Gamma-Gamma Coincidence
Author: Tim
I have waited 25 years to perform this experiment. All I needed was a second ORTEC ScintiPack to execute it. Well, not really, but the recent eBay opportunity to get a second ScintiPack sure made it easy… I had everything else waiting for it’s arrival.
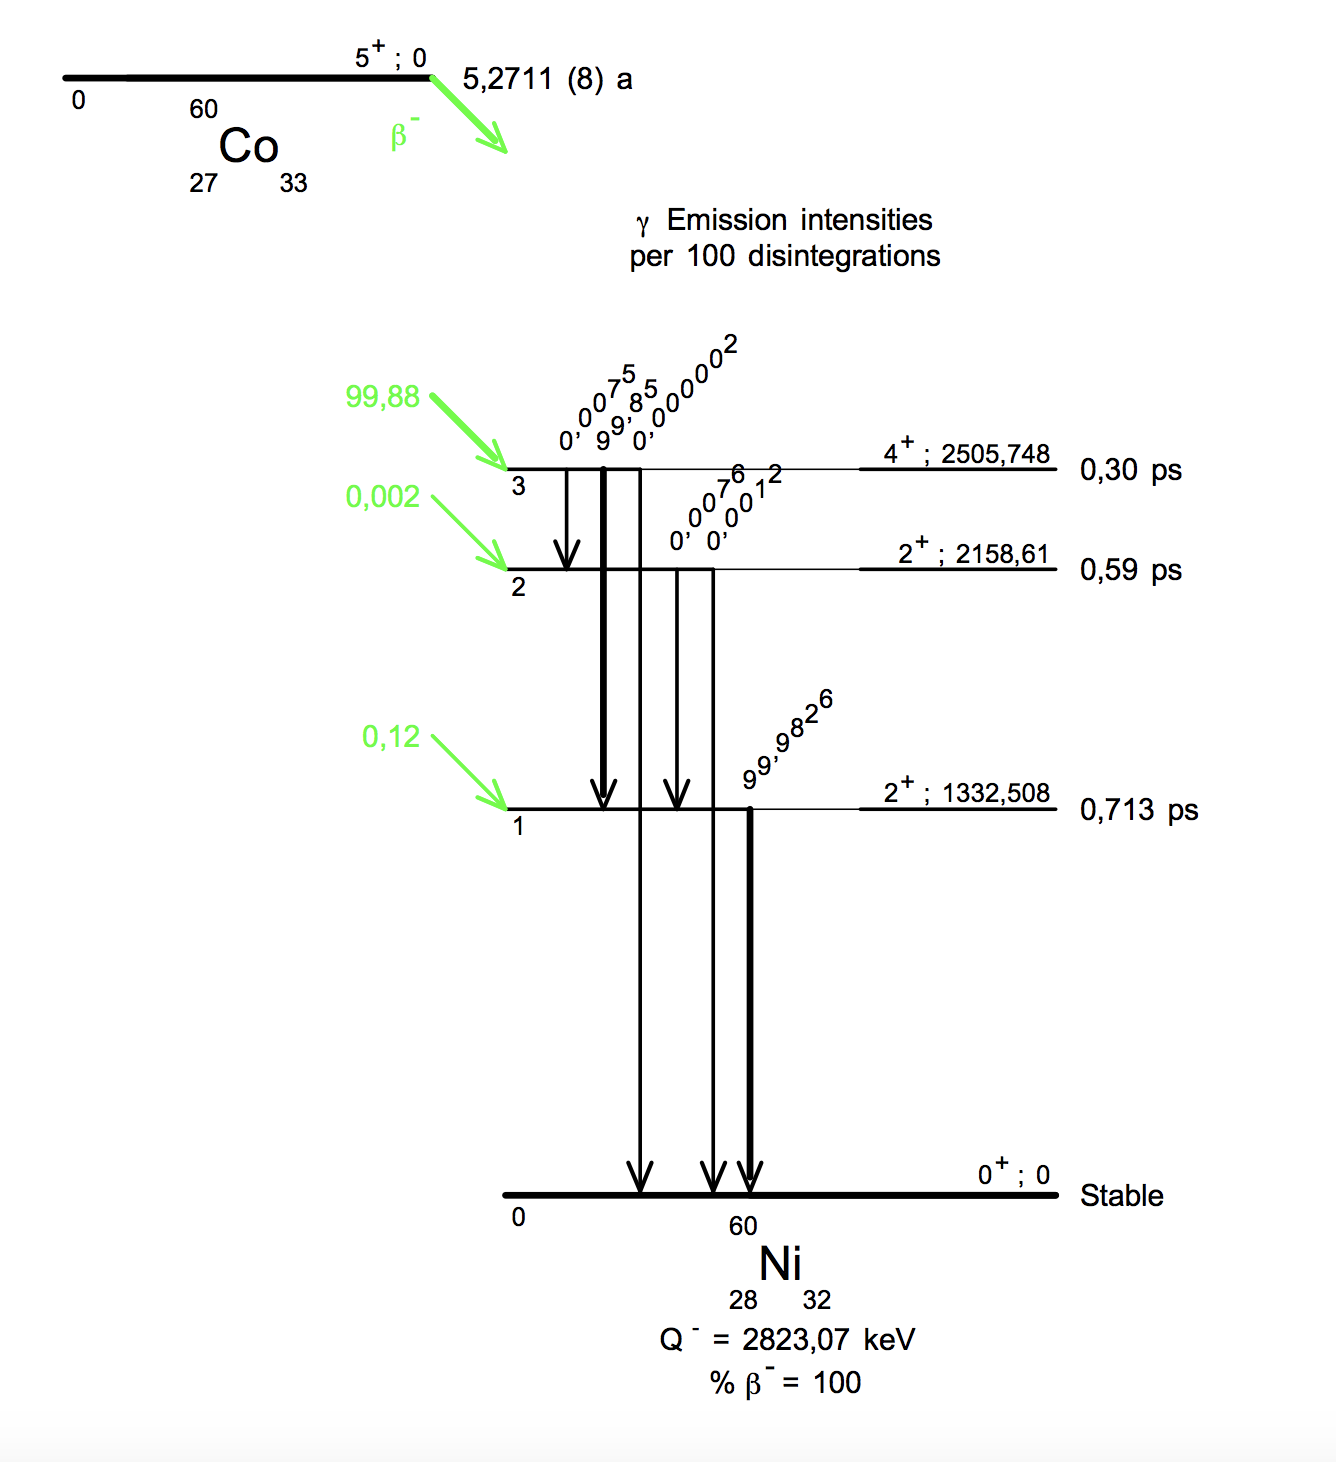
This experiment exploits the gamma-gamma coincidence of two gammas that (nearly) accompany every 60Co decay. 99.85% of 60Co ends up in an excited state of 60Ni, that with a half-life of 300fs which decays with 1173keV gamma ray to a lower, but yet another, excited state, which in-turn decays to the 60Ni ground state with a half-life of 713fs with the emission of a 1332.5keV gamma ray. The relatively short times between these transitions makes it seem that they both are emitted simultaneously, and justifiably so, since the timing between the two emissions is typically under a picosecond!
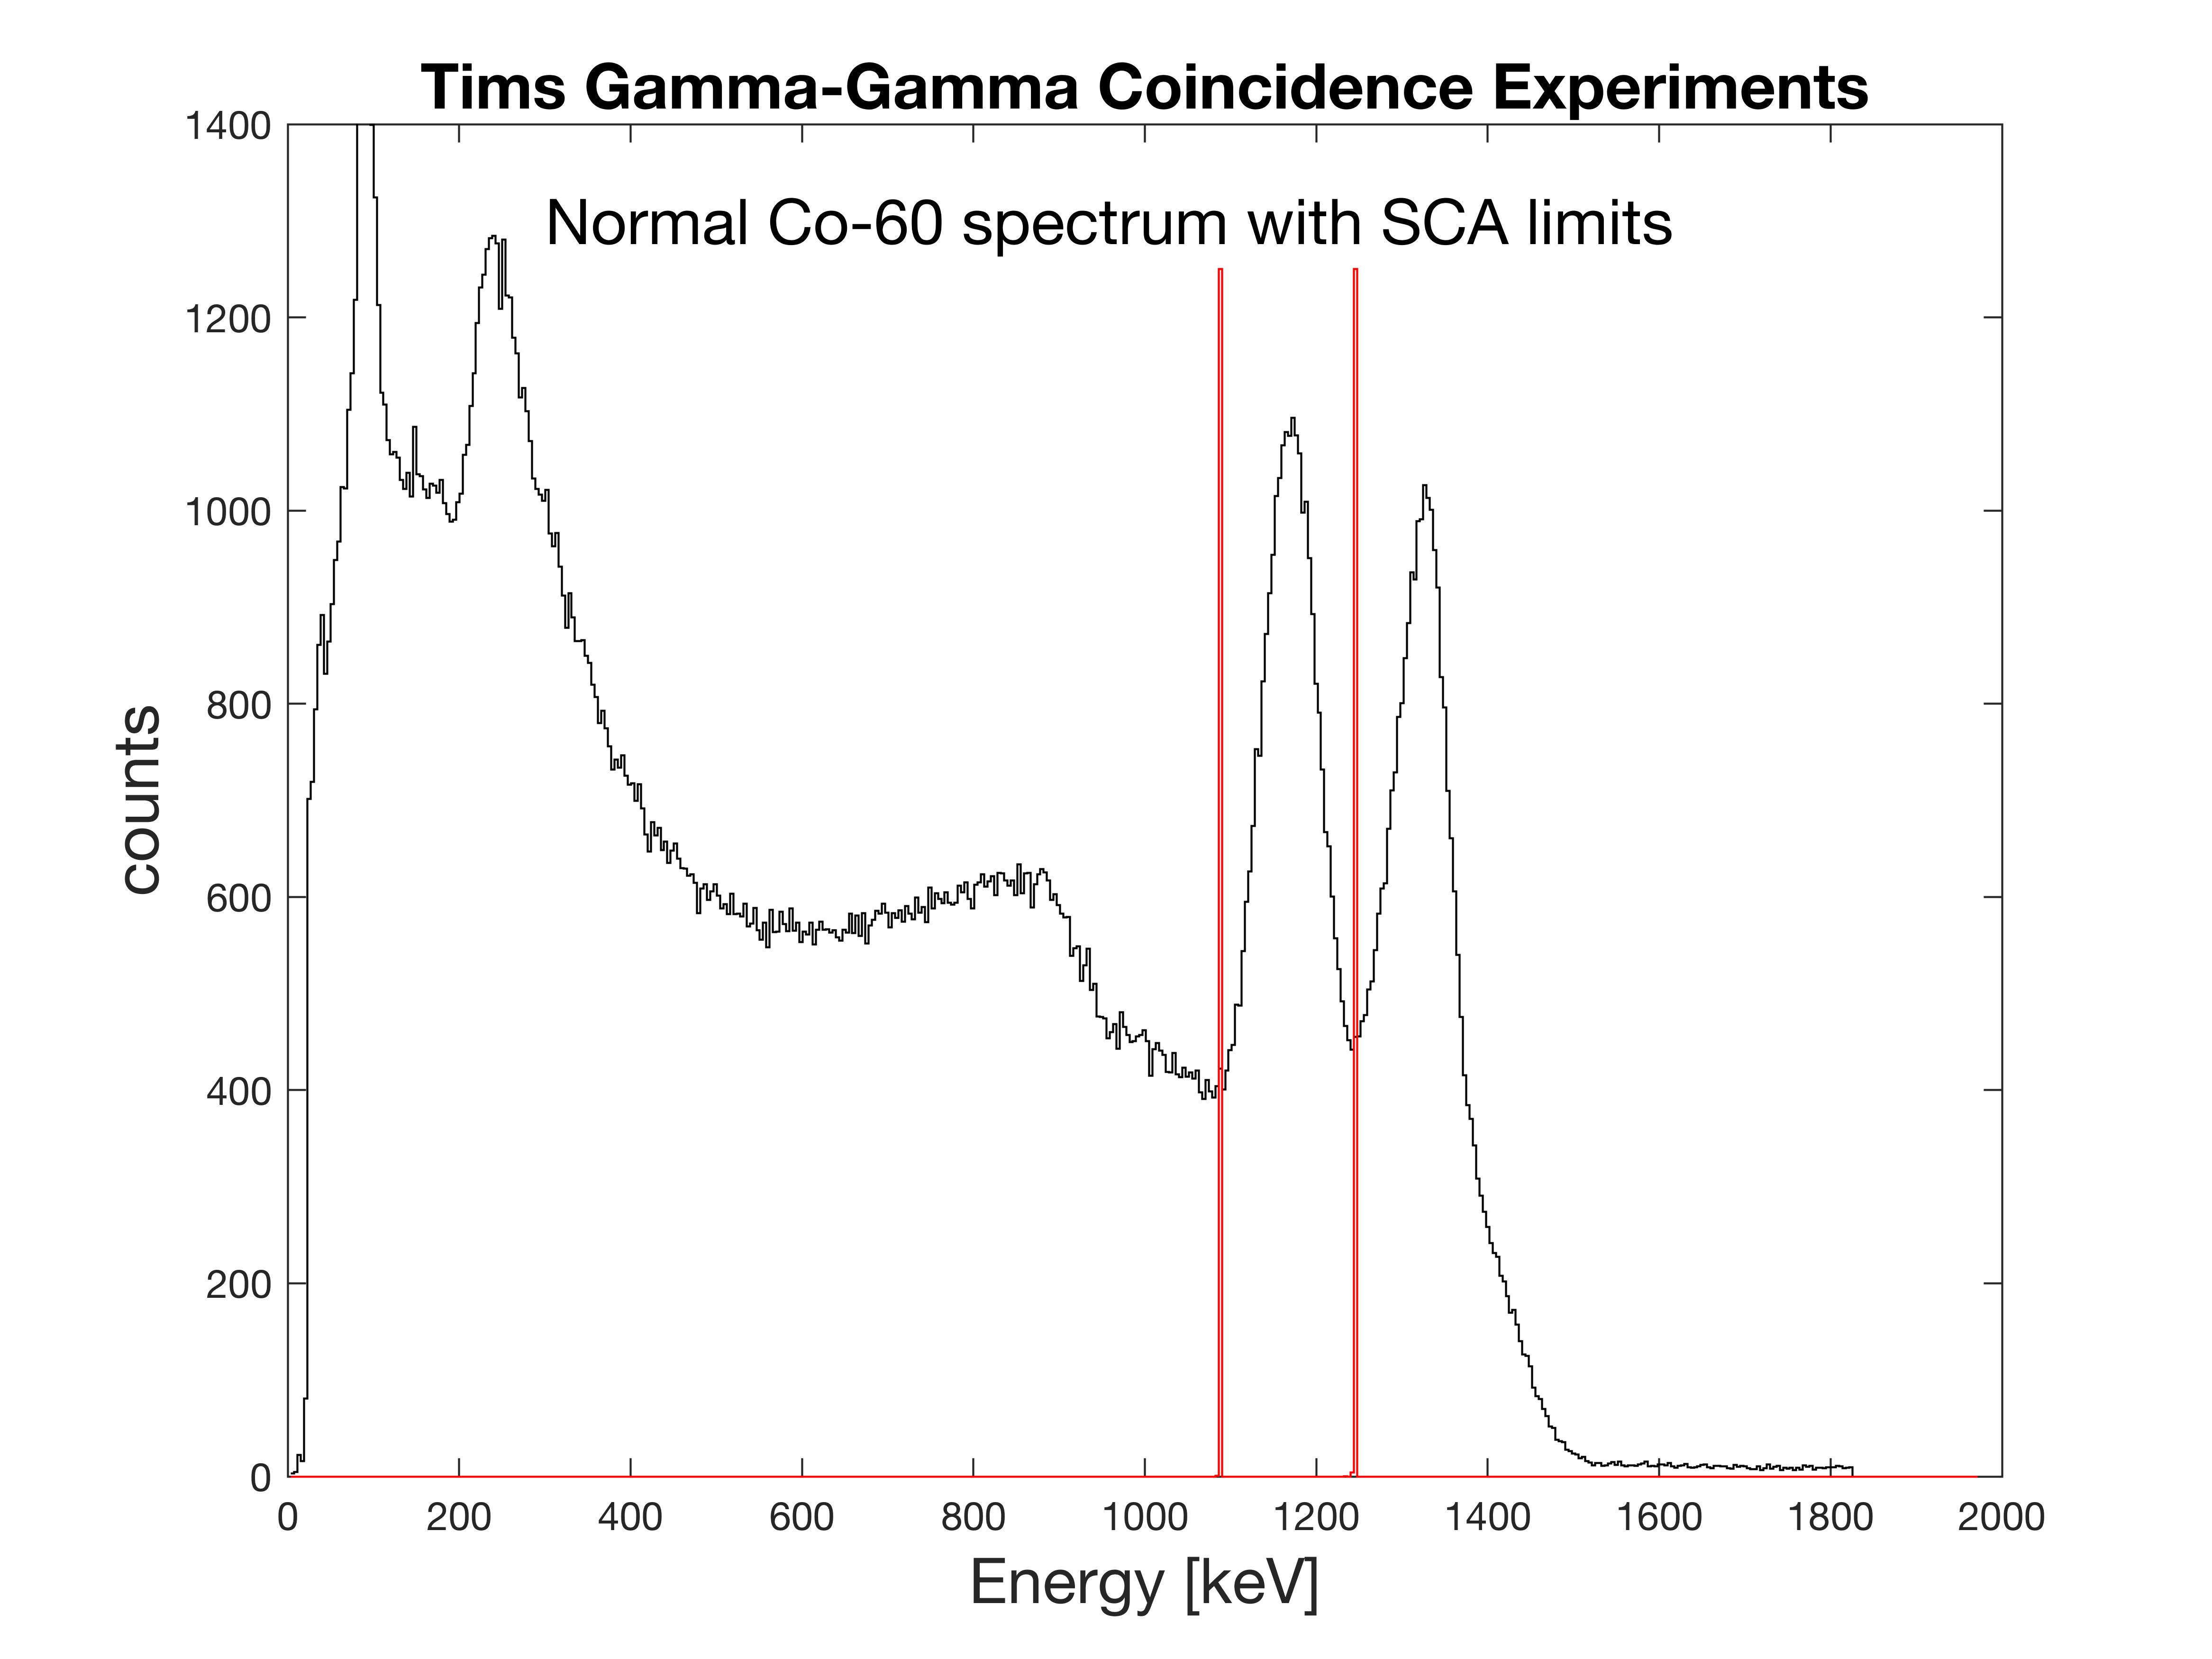
60Co is the standard by which all gamma ray spectroscopy systems are measured and calibrated against. Specifically, the 1332.5keV line is the line that all systems compare their performance by. Gamma ray spectroscopists, both professional and amateur alike, can draw the 60Co gamma spectrum from memory – the twin pillars of 1173keV and 1332.5KeV, and their combined Compton Scattering tail.
This experiment aims to splits up the pair through a bit of selfless promotion by their twin; one sibling photon takes the back stage in order to let the other photon shine all its own. This goes both ways…

The concept is simple. You need two detectors that operate in coincidence, where one plays the role of the tigger detector from one of the two gamma rays, while the other detector measures the energy of the second gamma ray. The trigger detector must also have the ability to measure the energy, but it’s energy information is turned into a simple digital logic signal that says “go/no-go.” The trigger detector can be set (through a single channel analyzer, SCA) to only register an event of just the right energy. If the gamma ray energy is too low, or too high it is ignored, but if it falls within a preset energy window, it is registered. Similarly, a digital signal can be generated from the full energy range detector if an event of any amplitude occurs. If the two digital signals occur simultaneously (within a 100ns window in this case) then we can declare a coincidence event, having individually captured the two gamma rays in our two detectors from a single 60Co decay.
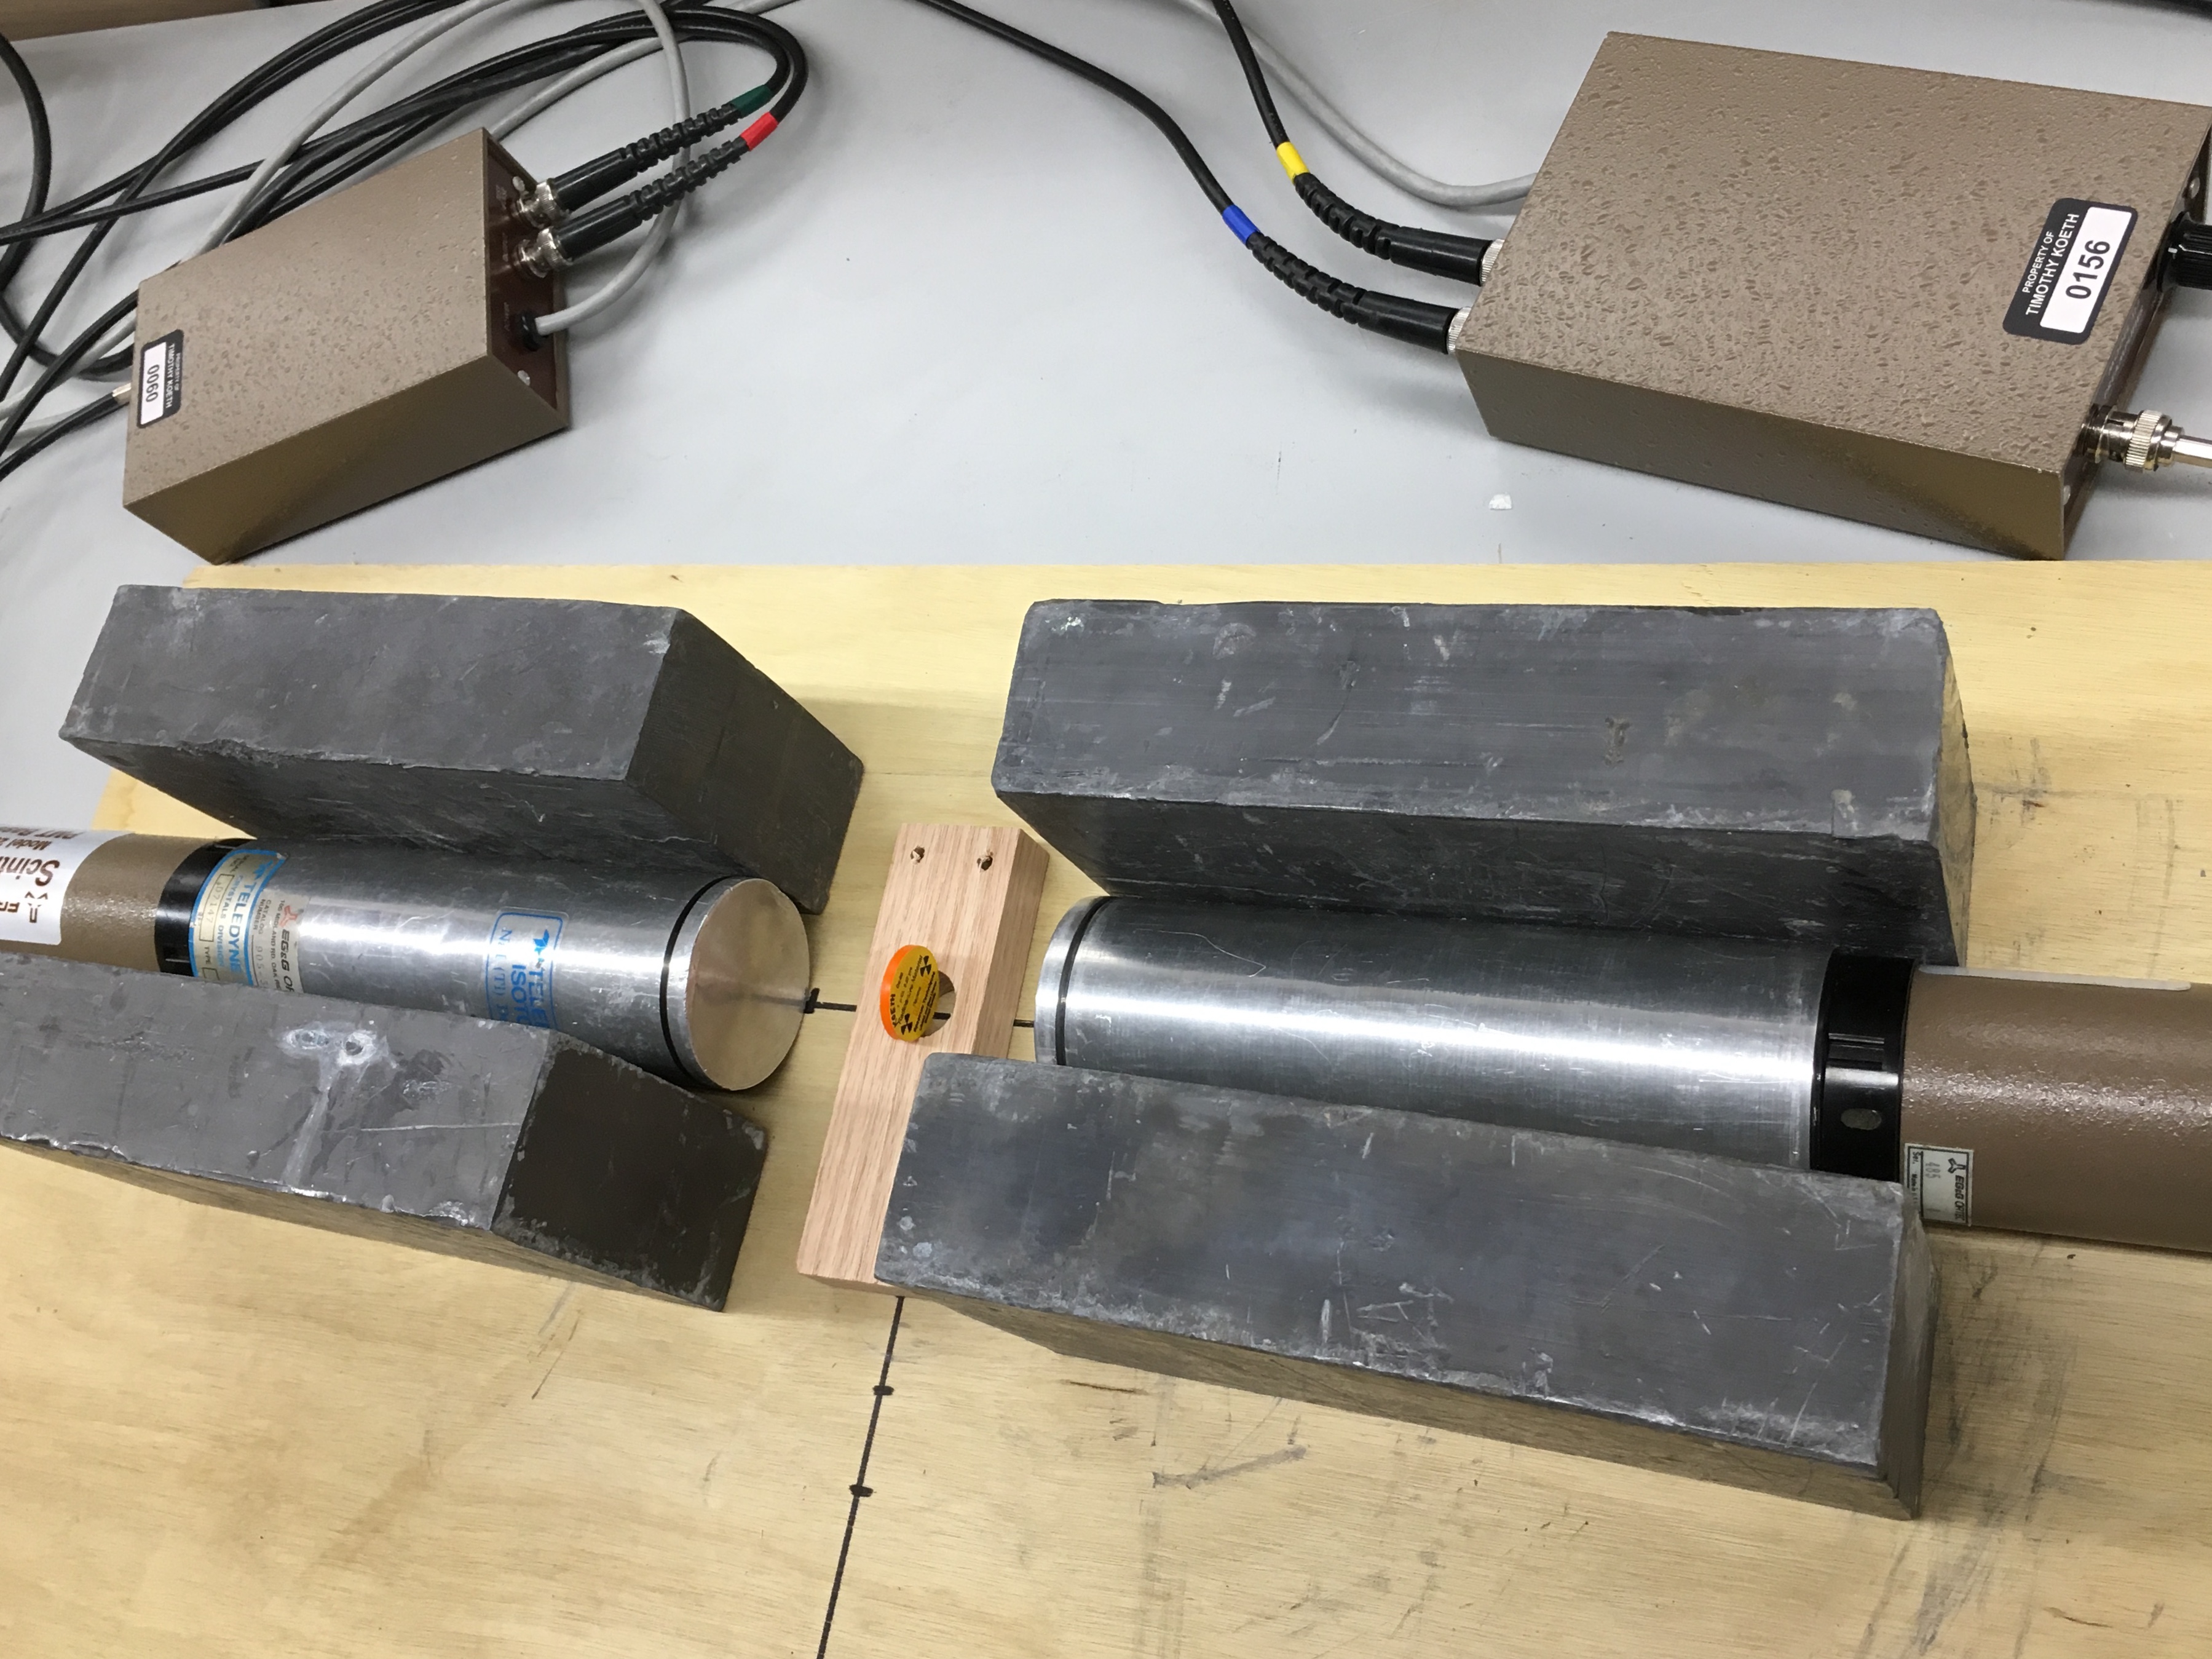
I use two 2×2-inch NaI(Tl) detectors oppositely facing each other with a small exempt quantity 60Co source centered between them.
Let’s make the conditions for triggering, and hence coincidence, a bit more specific. If there are two simultaneous gamma rays of discrete and separate energies from each 60Co decay, then triggering on only one of specific energies in the trigger detector, means the second detector’s simultaneous event must be from encountering the other energy gamma ray. This is where one twin lets the other shine. By this energy specific energy trigger, only the other gamma ray energy can enter the detector that the spectroscopic data will be derived from, effectively eliminating one of the two paired gamma rays from the spectra. Each energy photon (photopeak in detector language) can take their turn being the trigger energy.
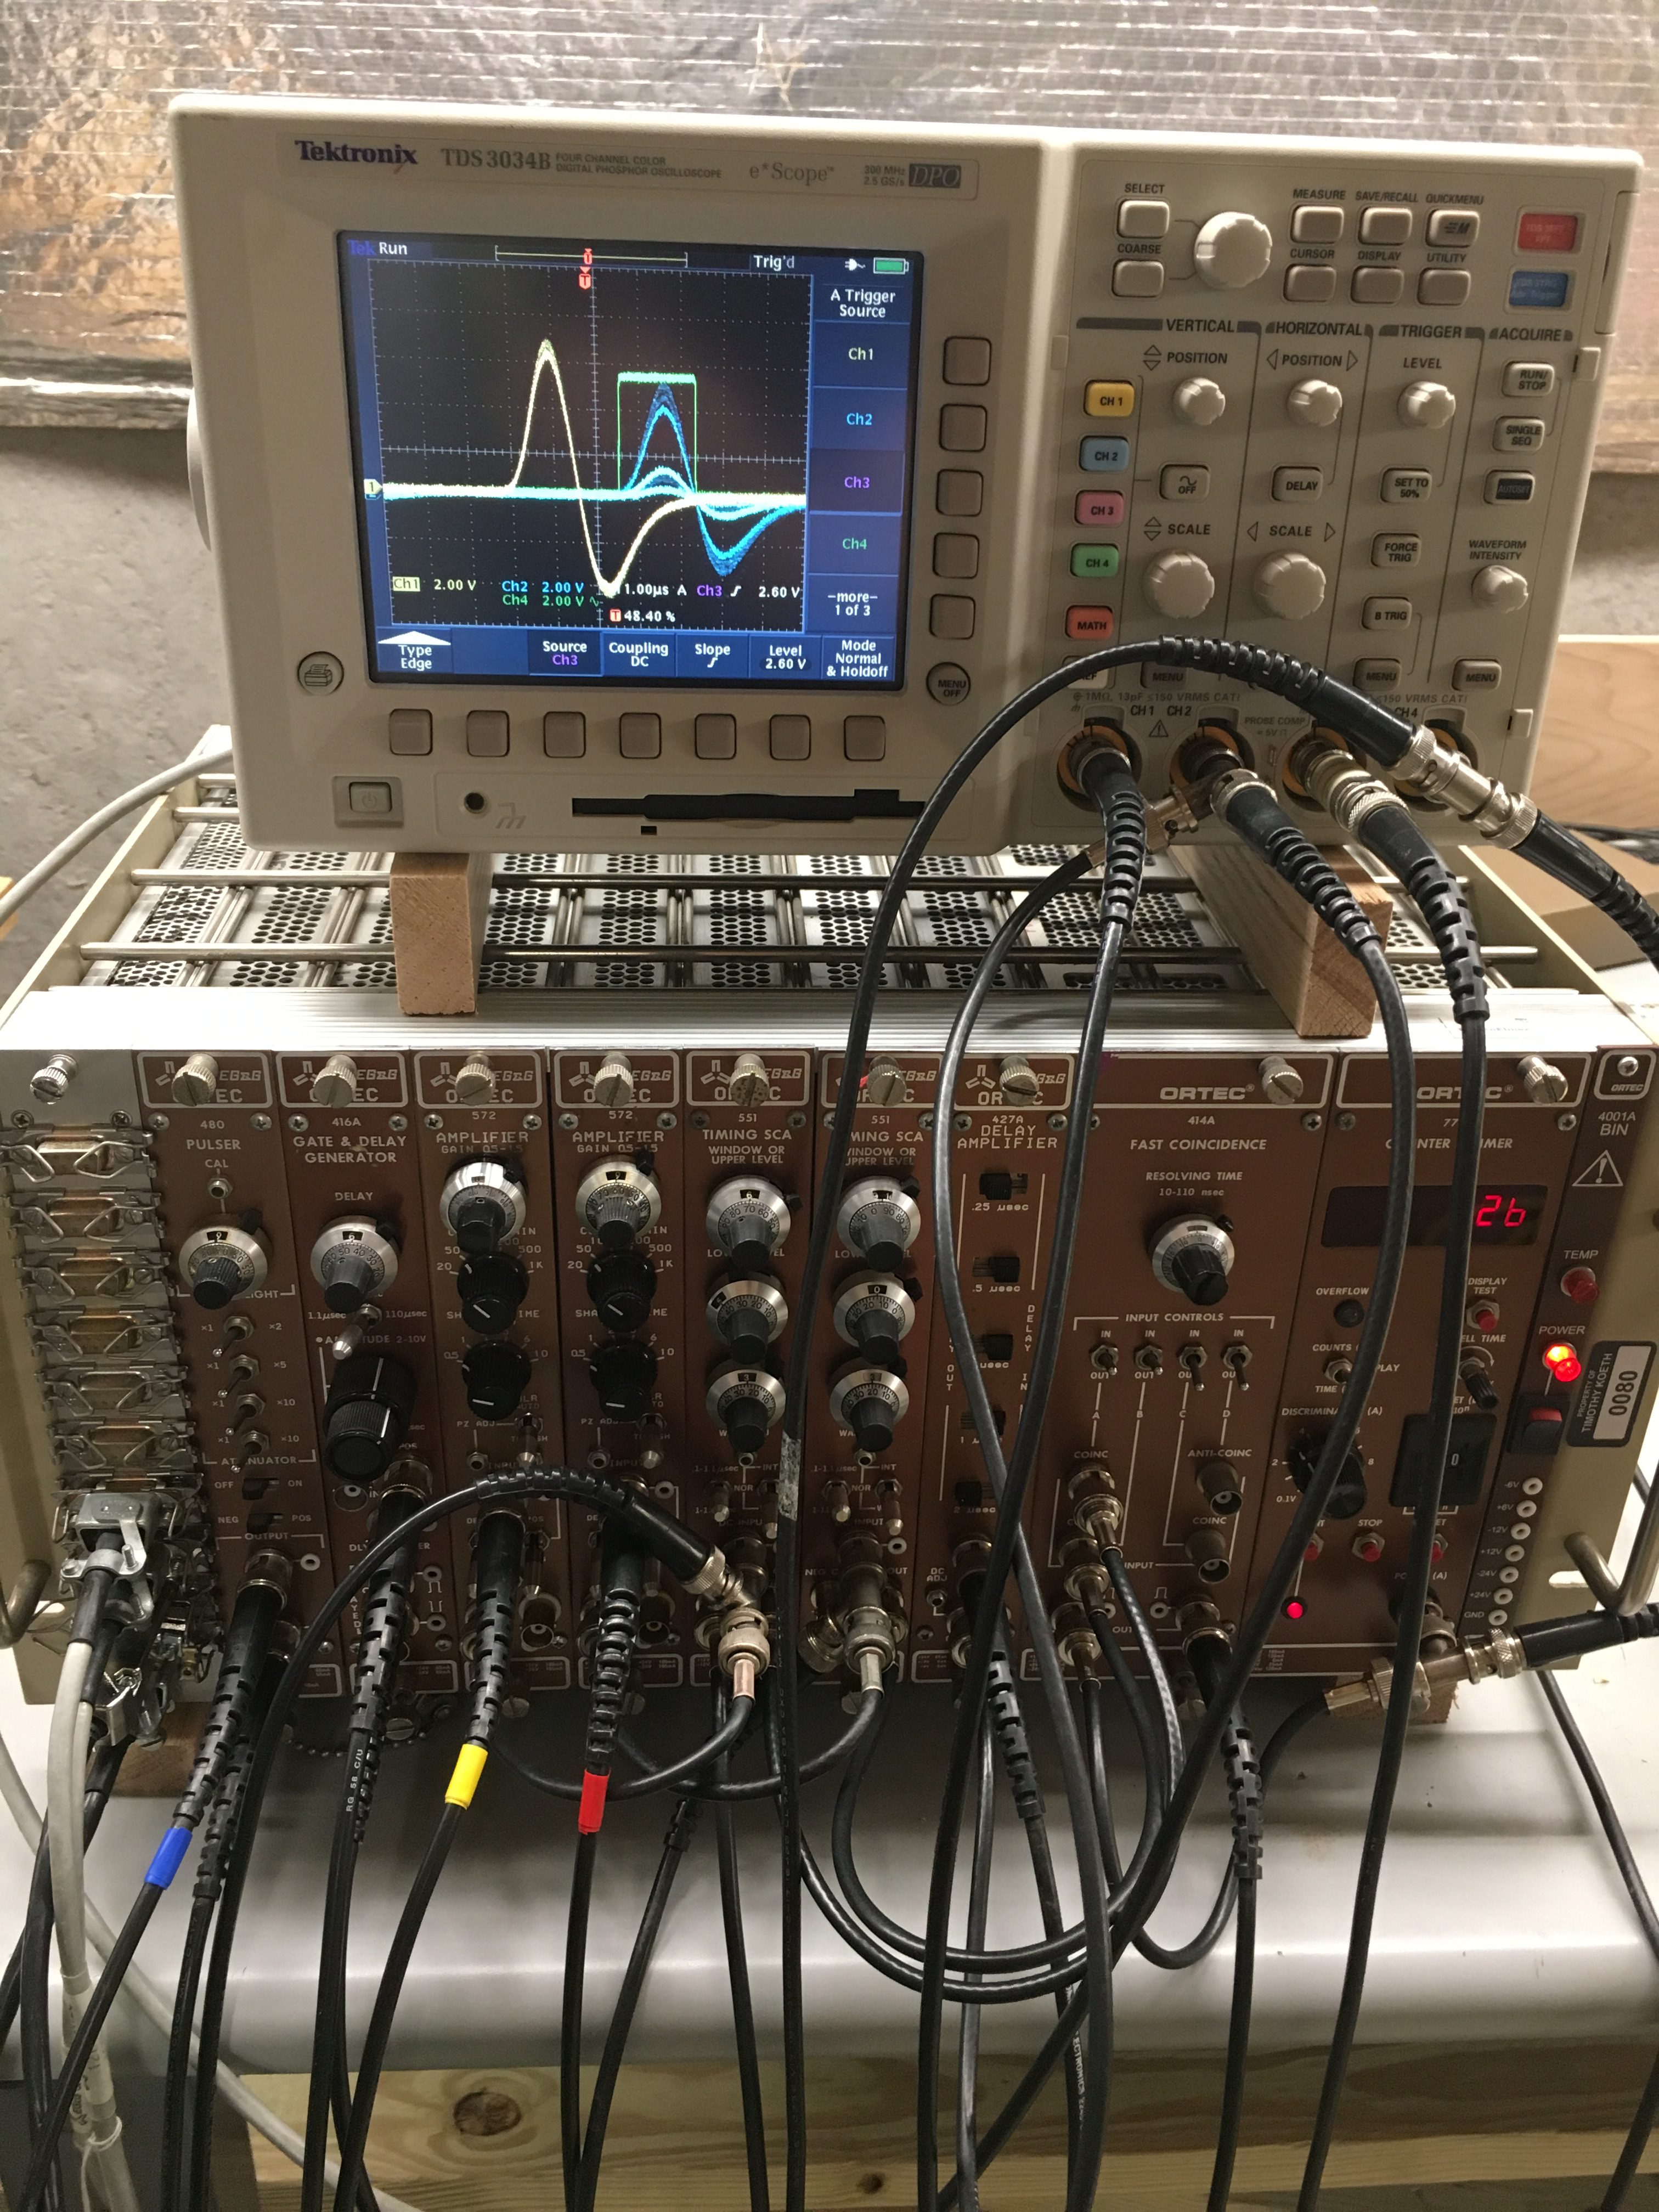
The next challenge are the electronics, getting two parallel paths of equal gain and control over timing is a bit tedious. It can all be done in a single standard NIM crate.
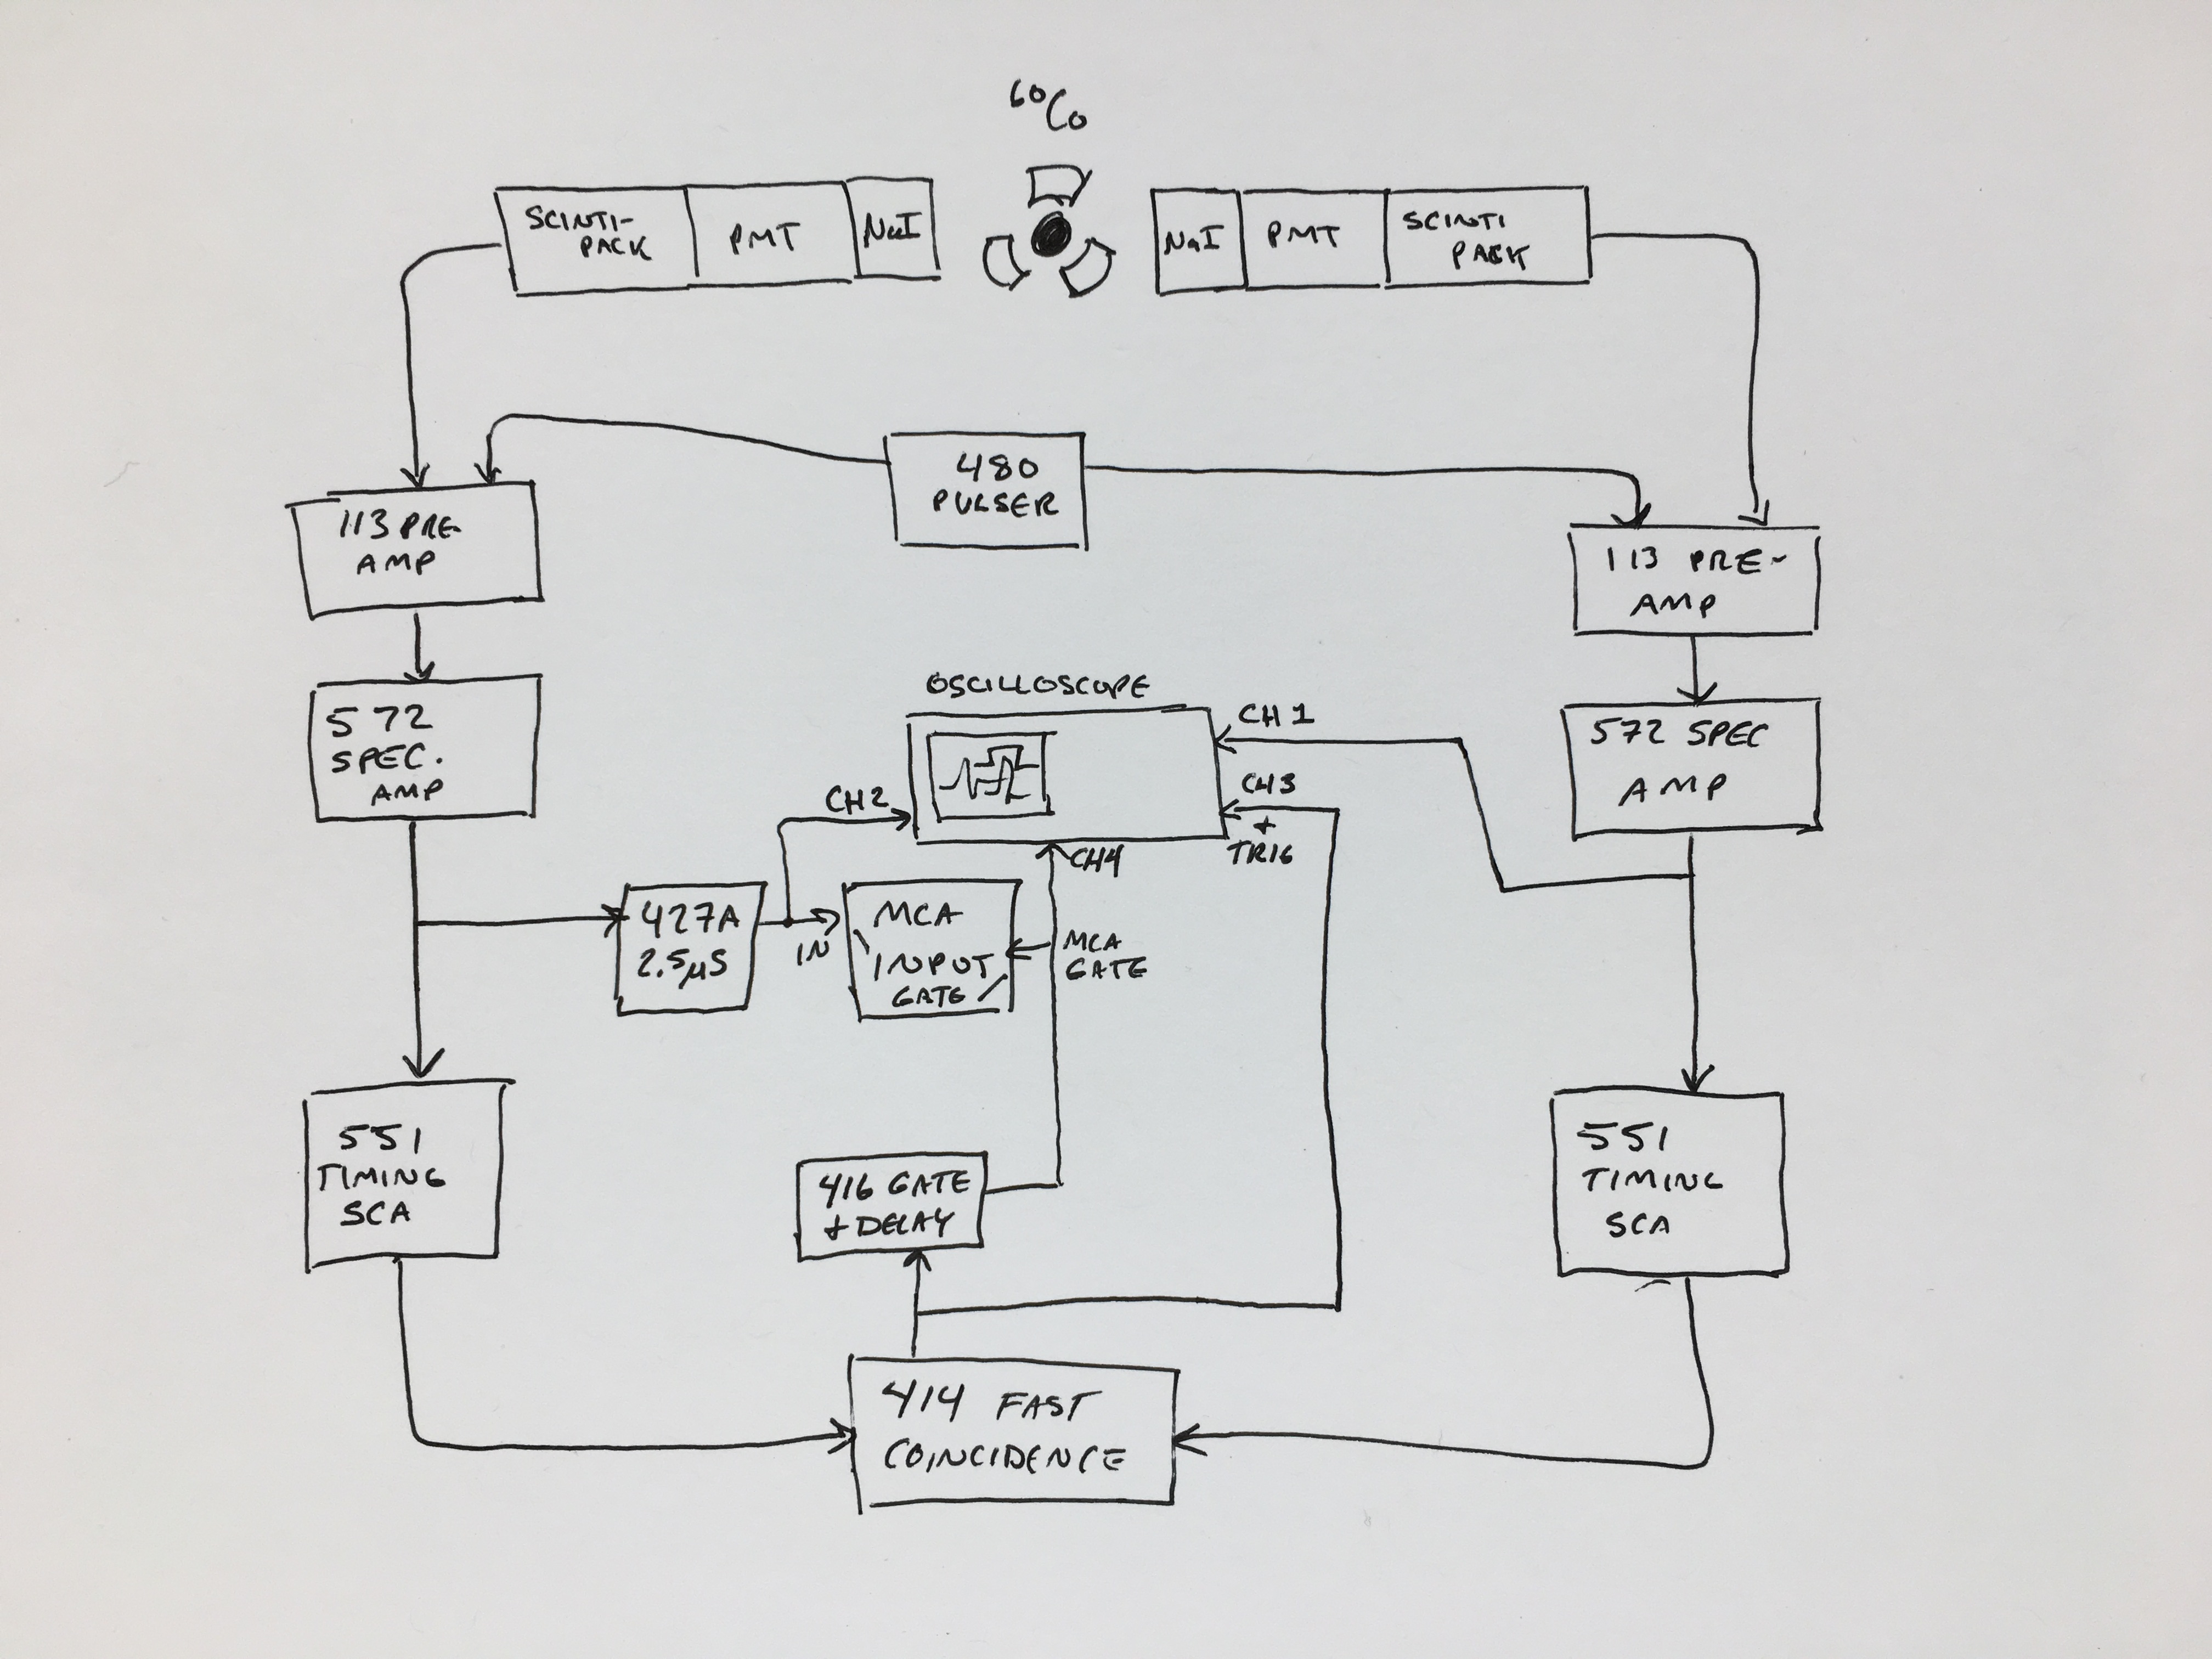
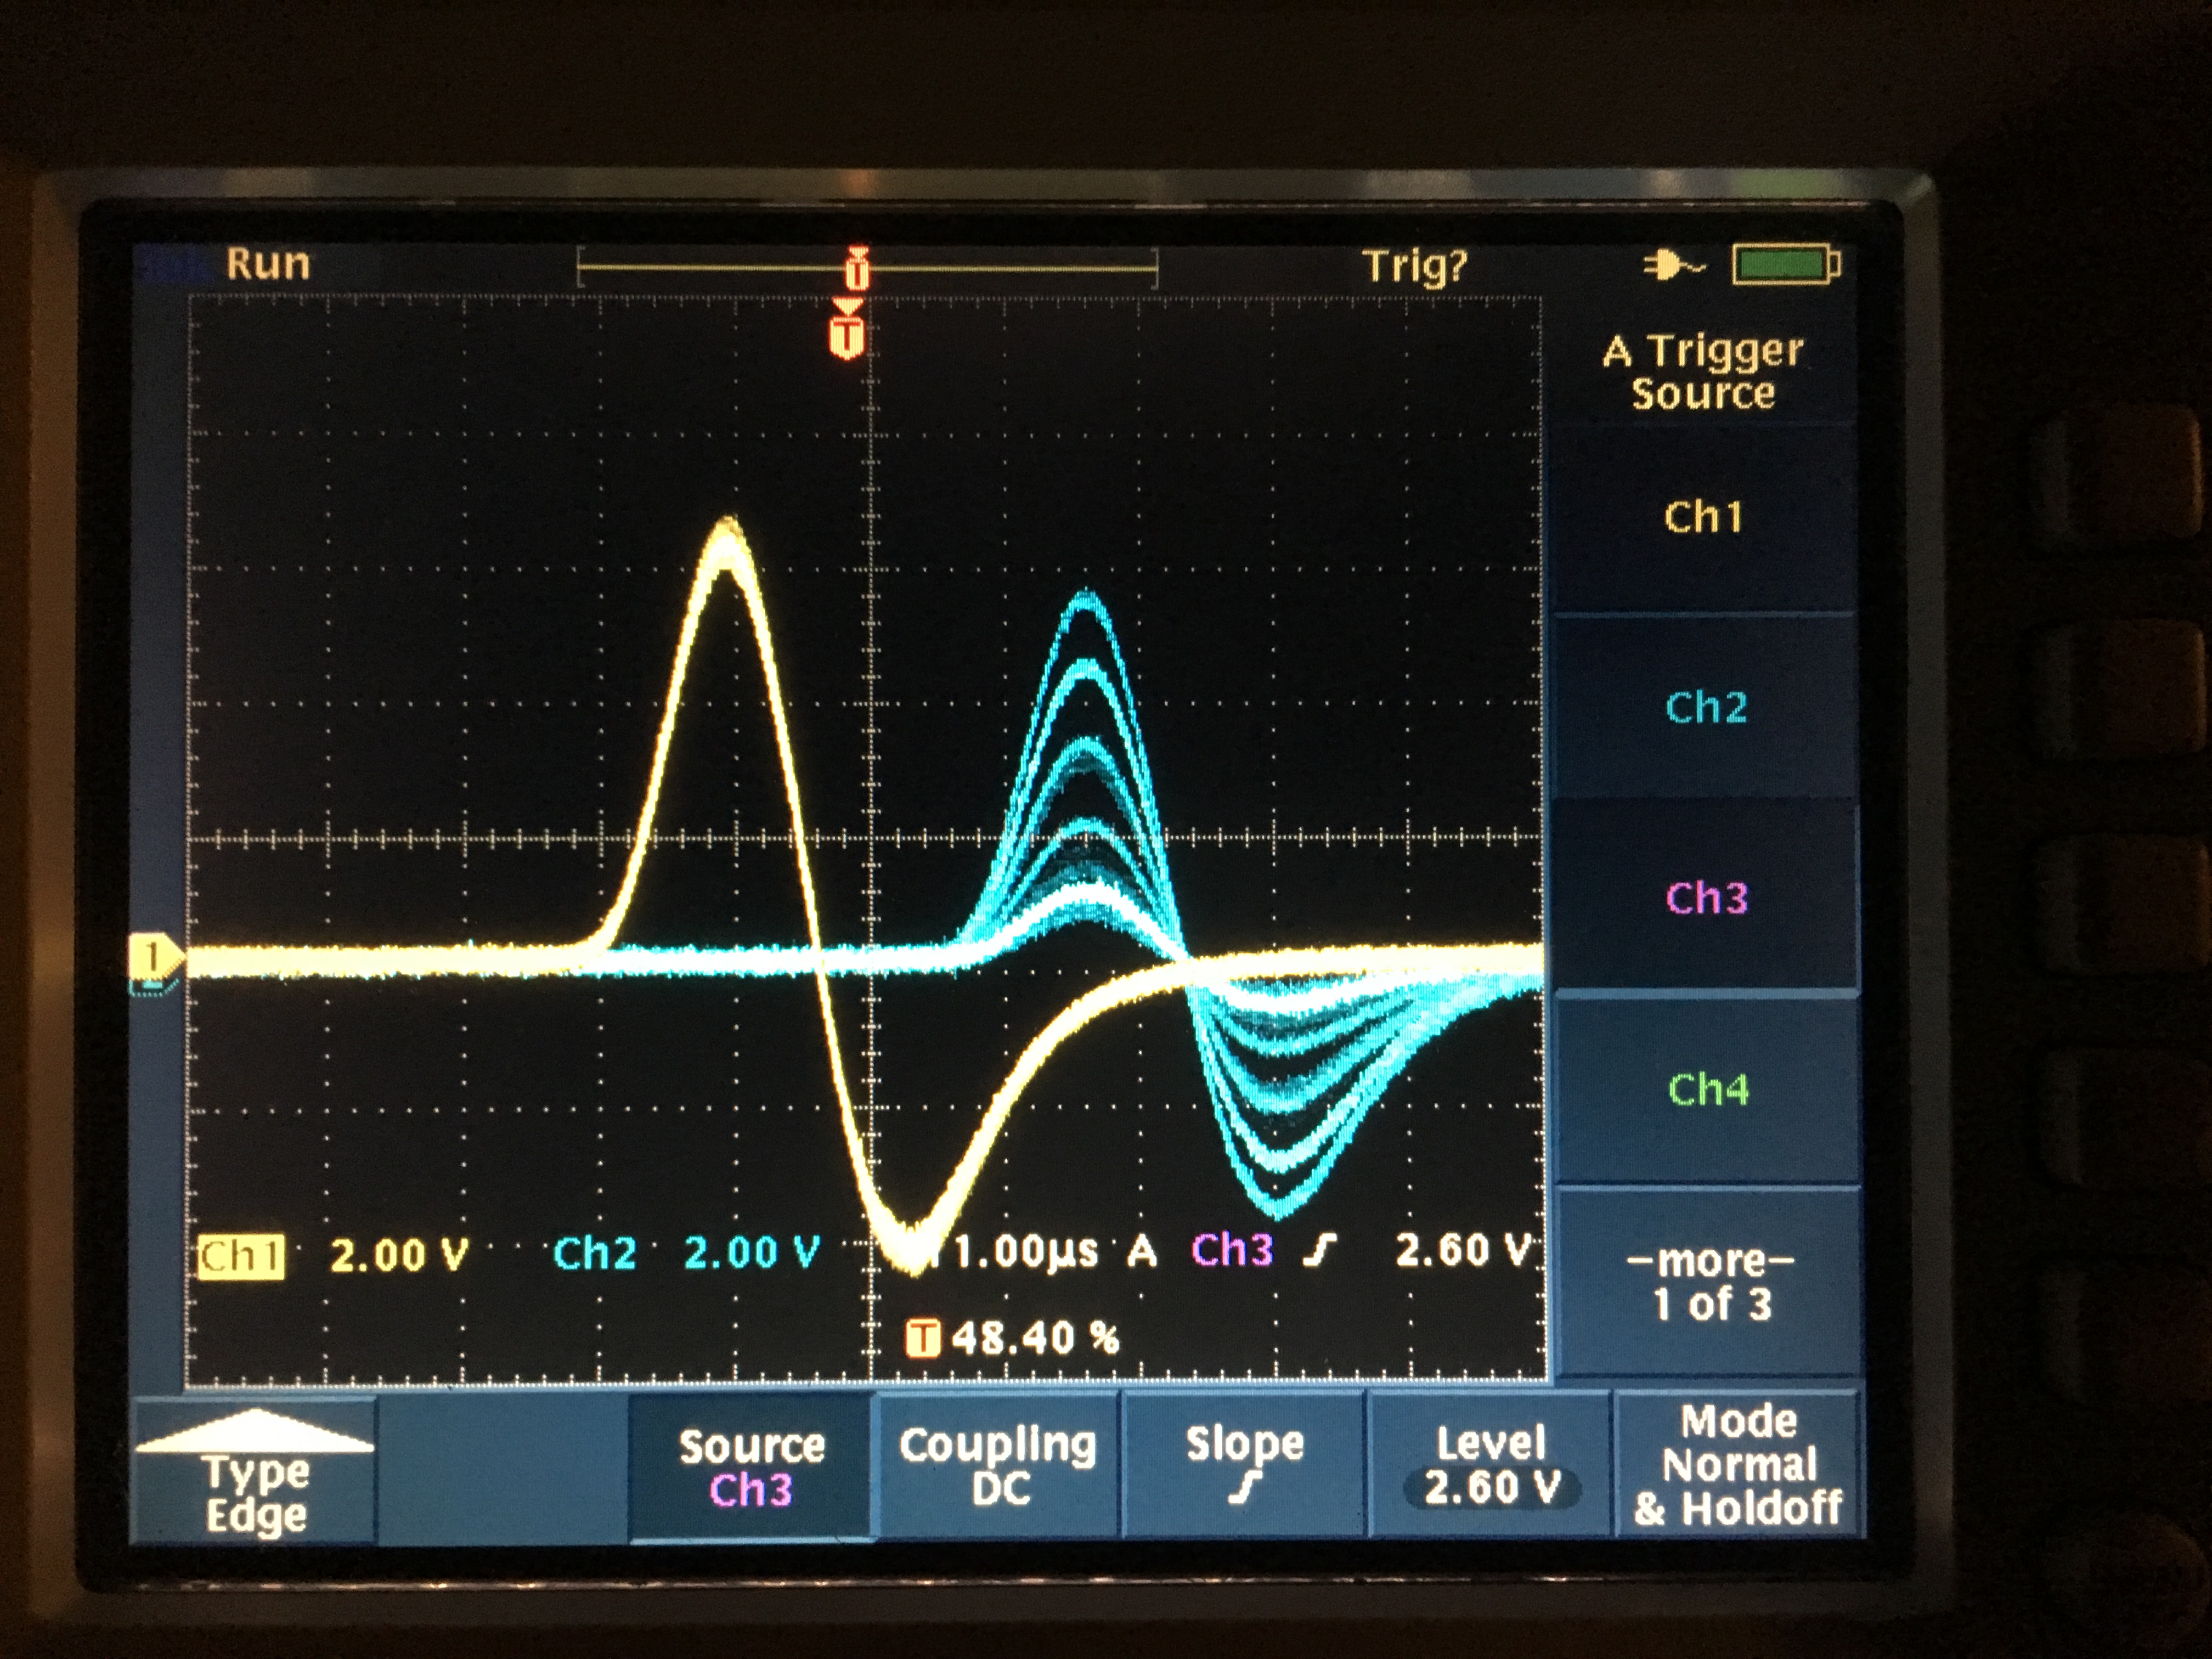
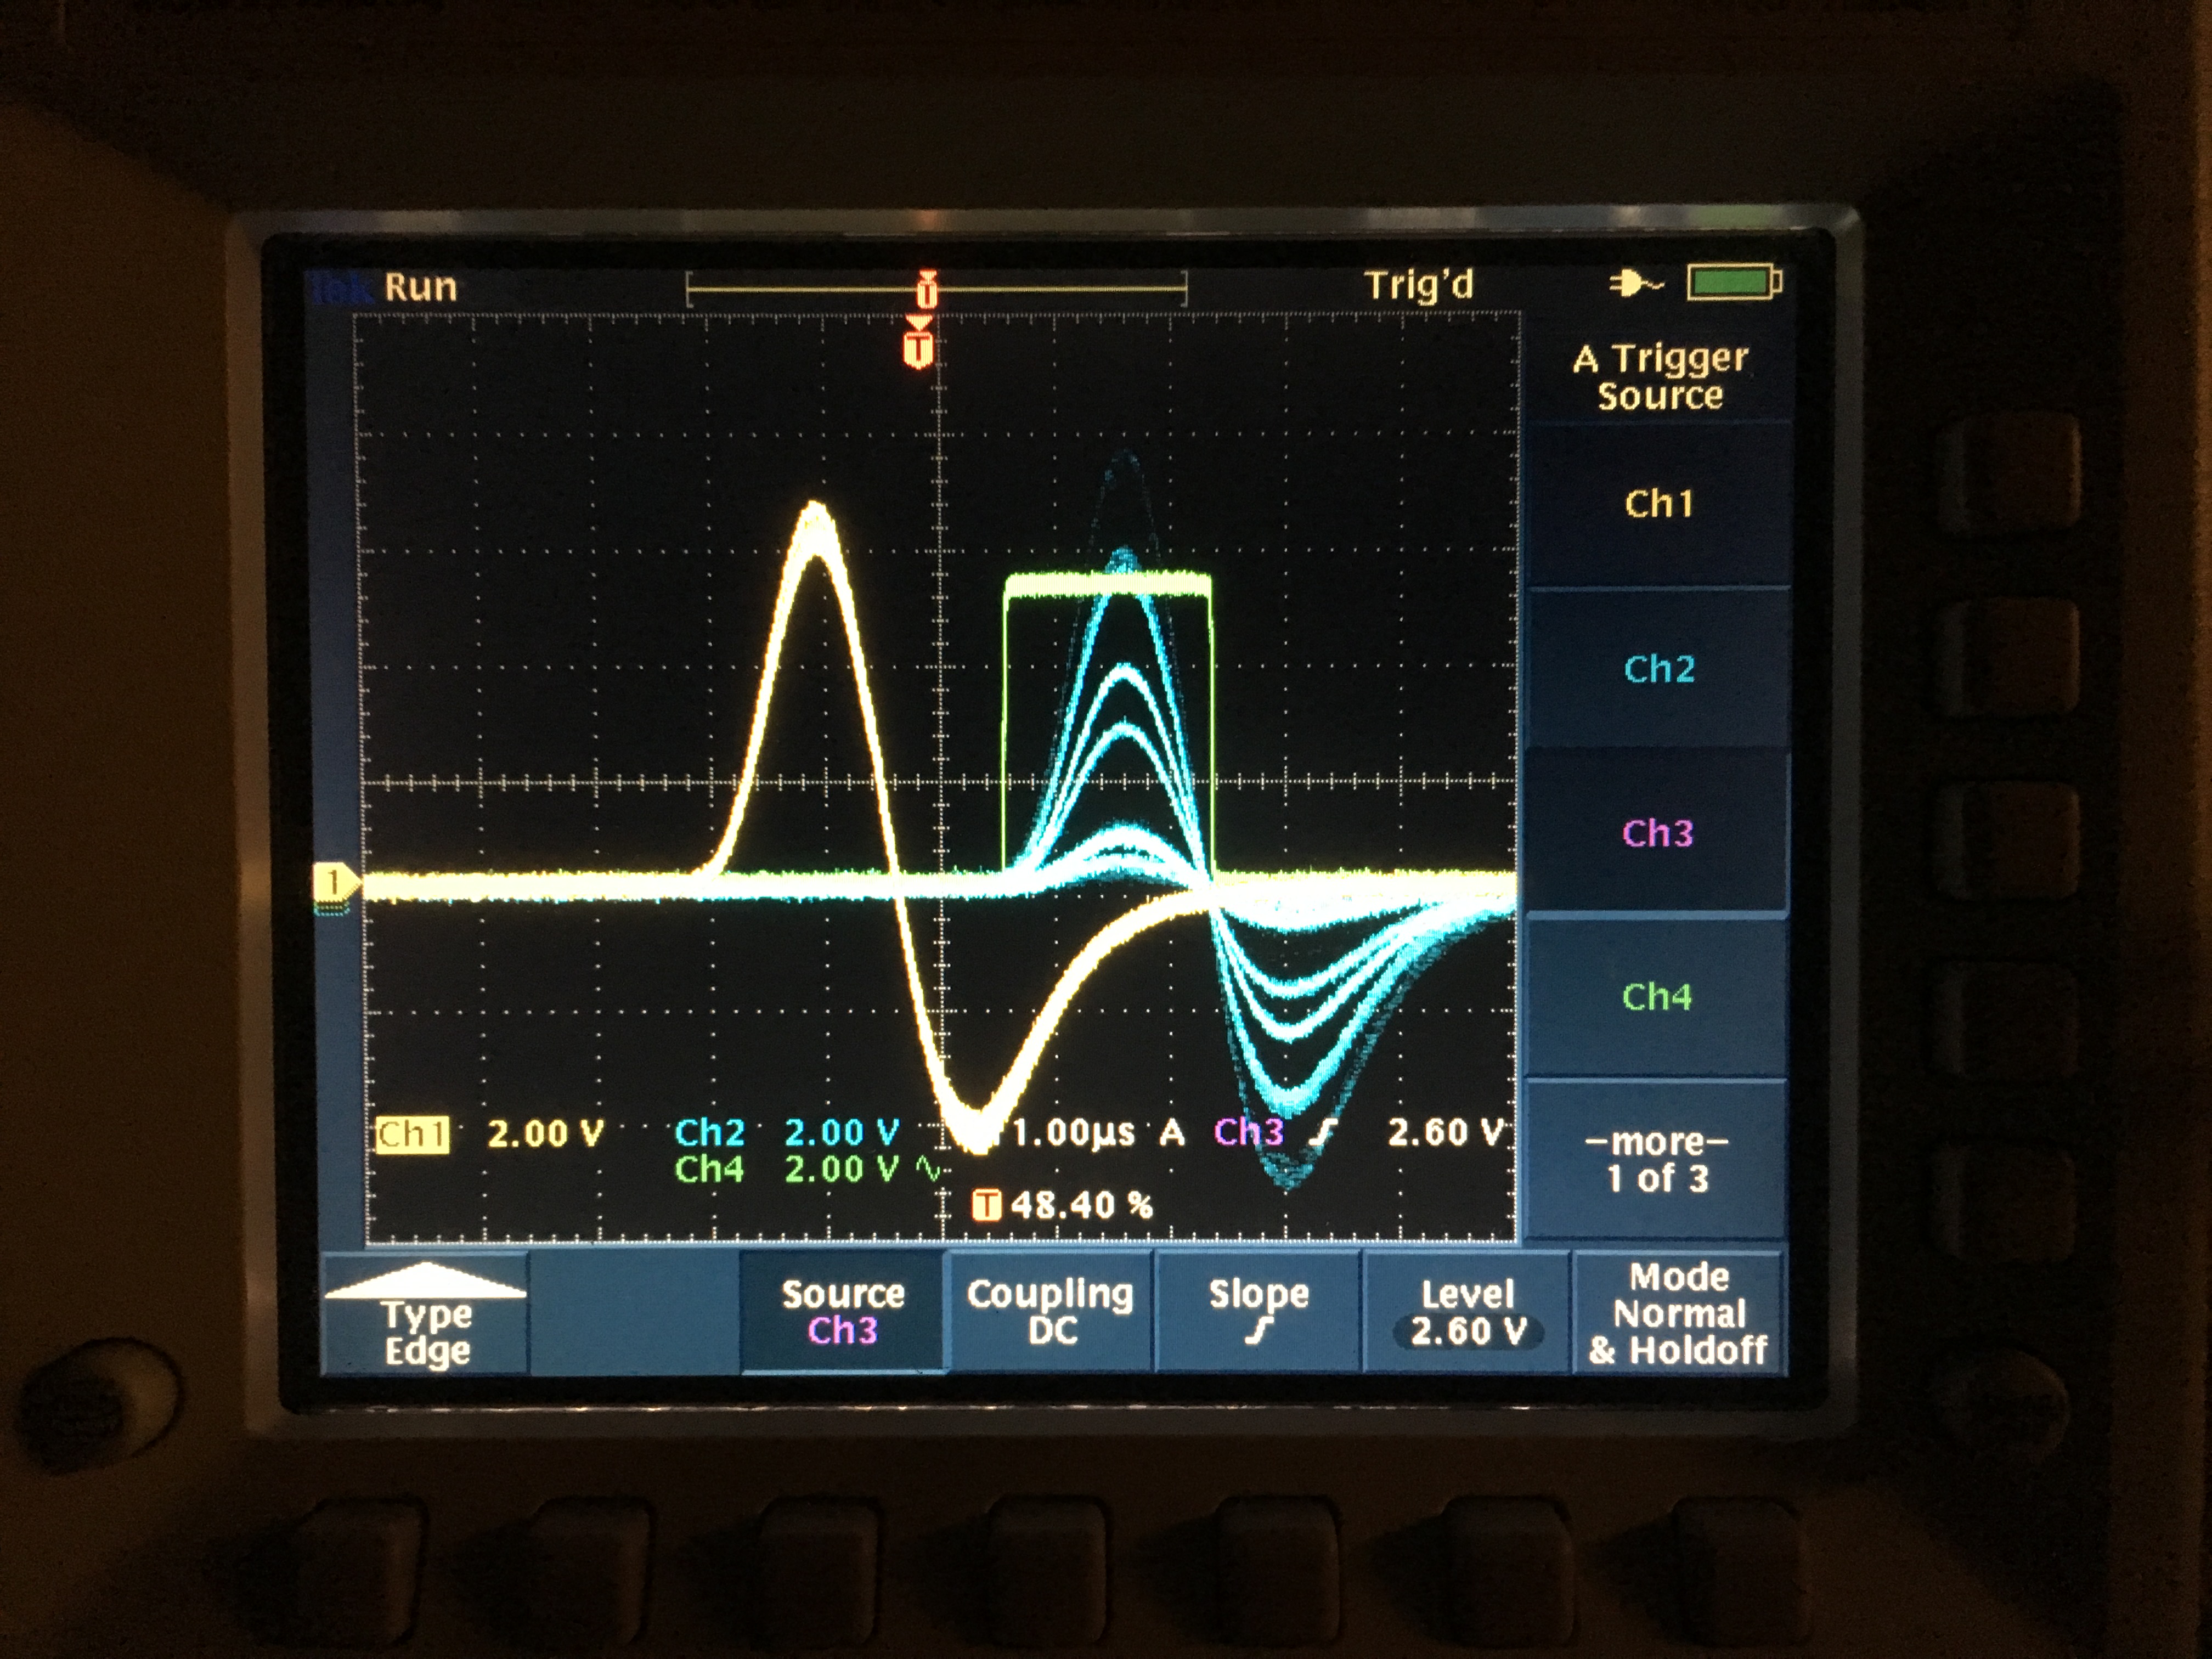
A timing delay is needed to permit the coincidence circuitry to generate a “gating” pulse. So the energy resolving detector signal is delay by 2.5us. Note in the image below, the varied pulse heights of the energy resolving detector, as it is seeing the entire energy spectrum, while the trigger detector’s pulse height is narrowly selecting the same pulse height (centered on one of the two photopeaks).
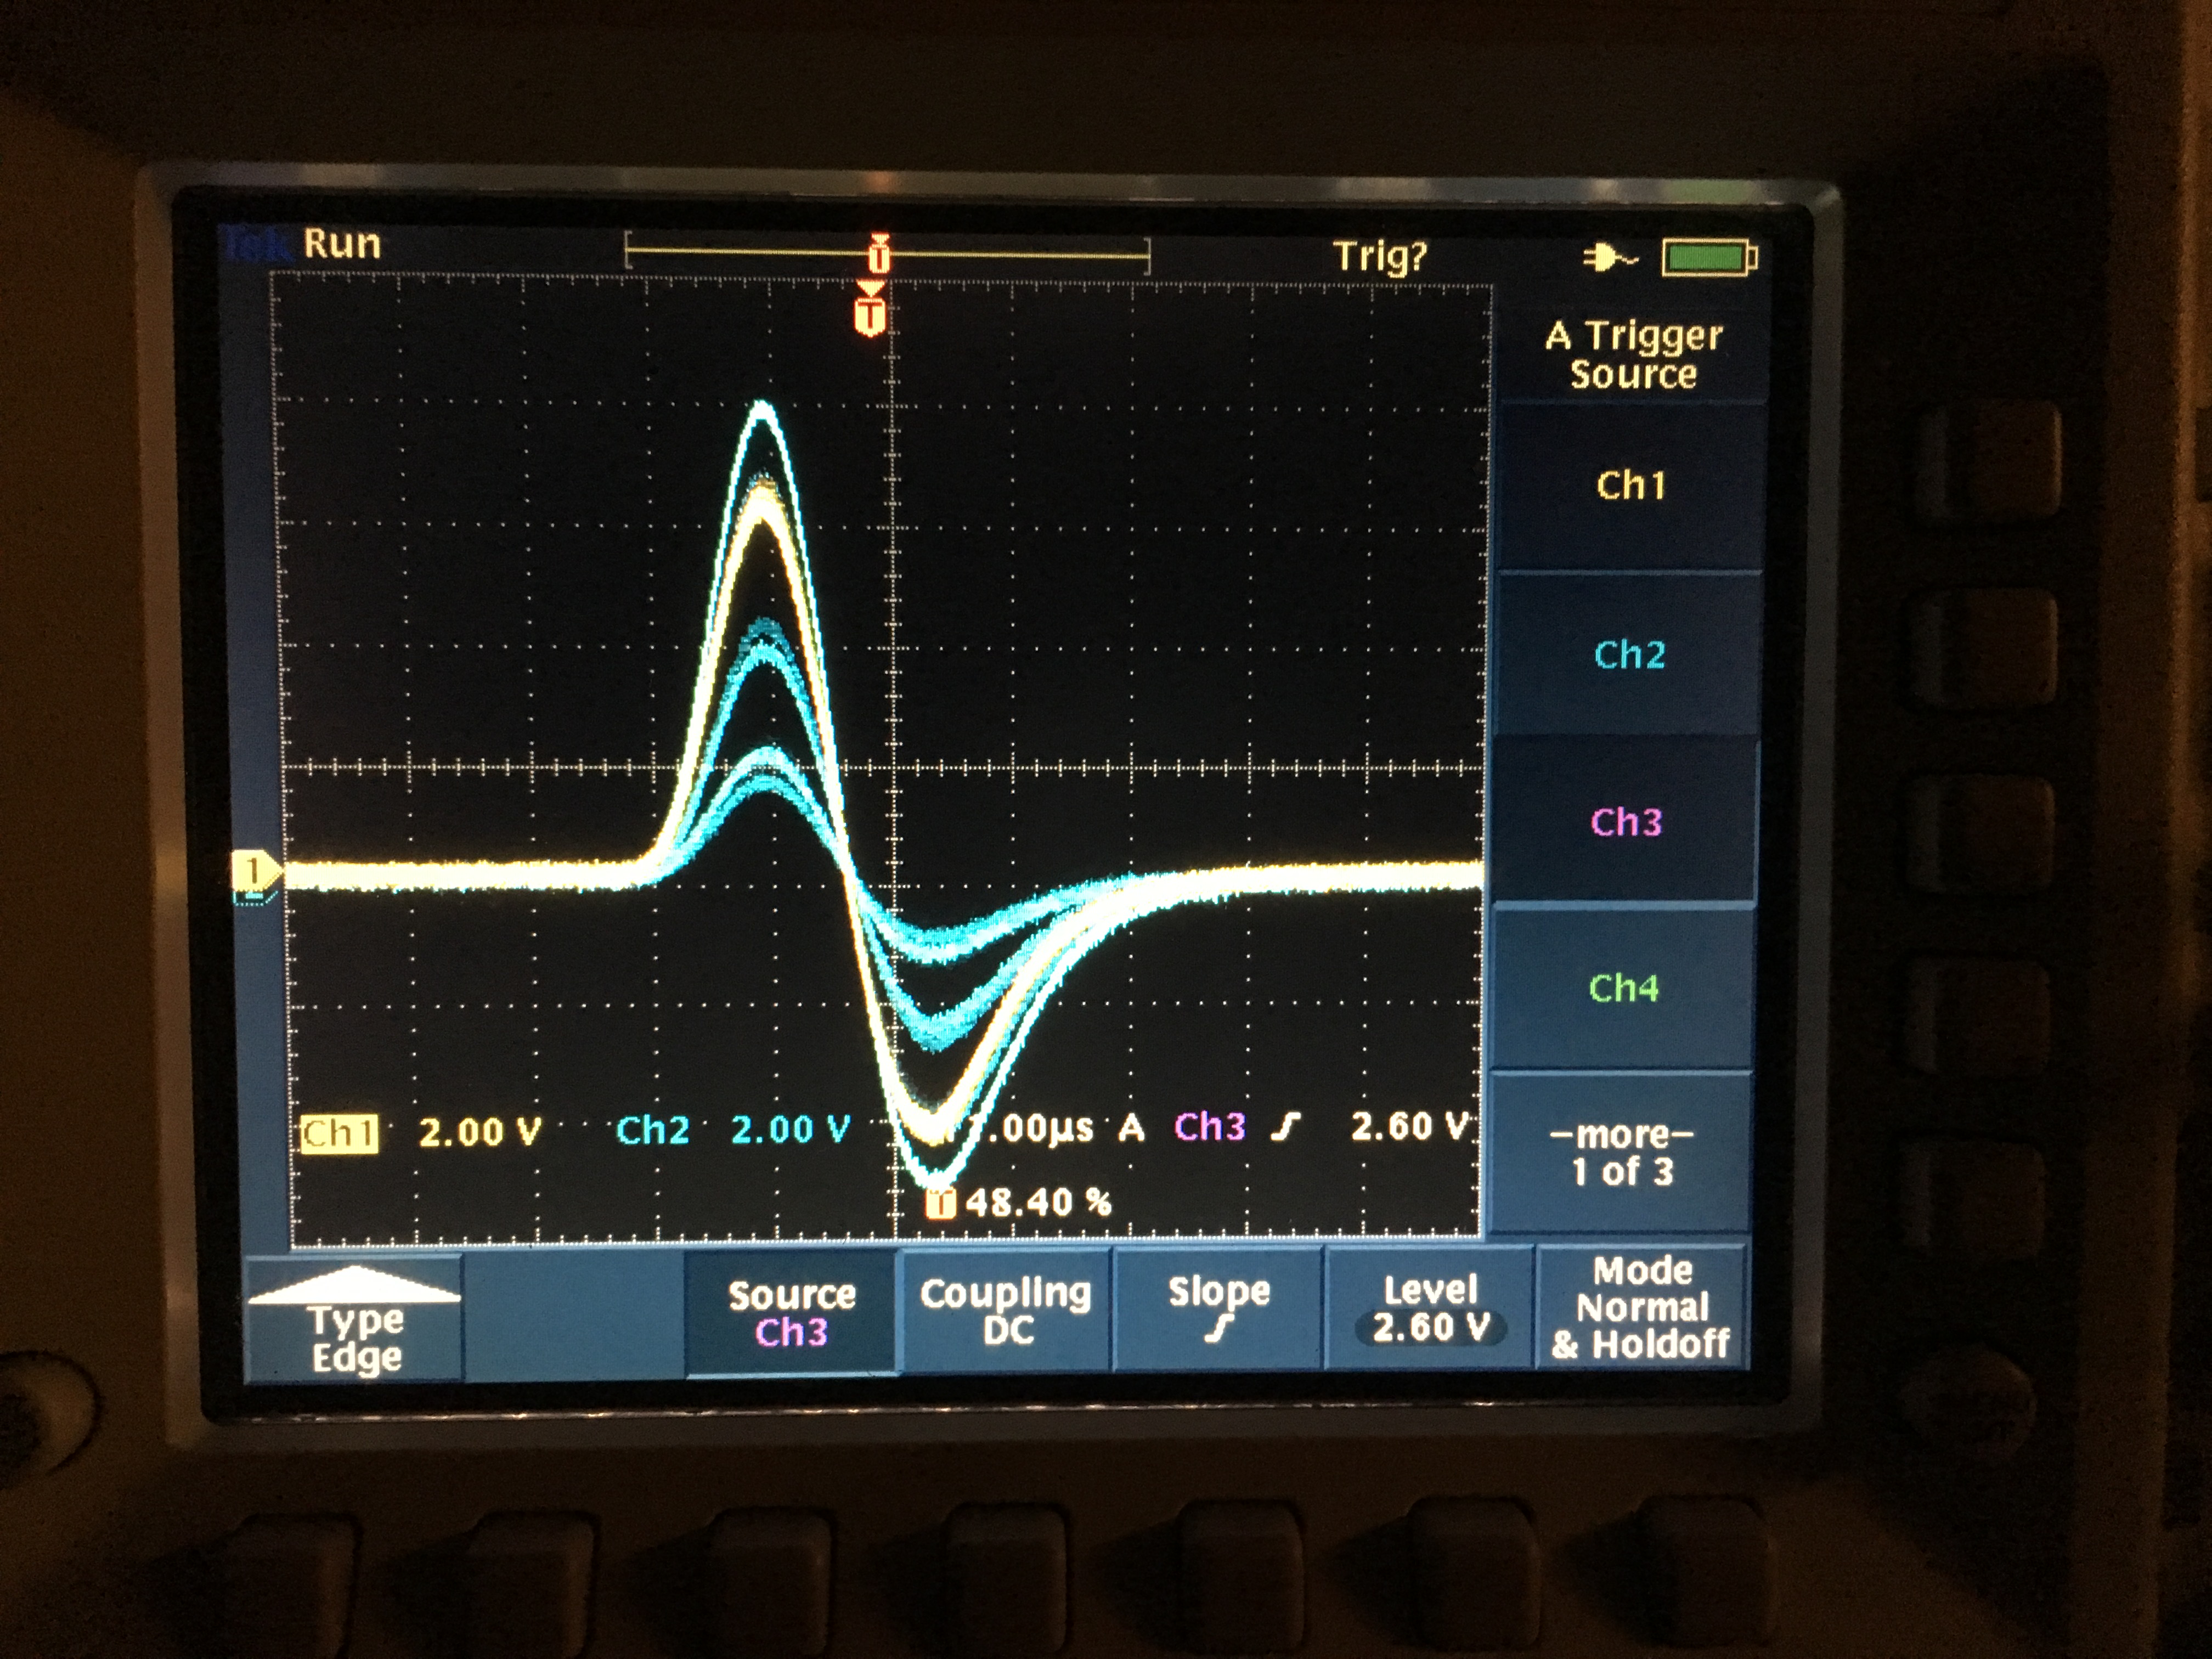
The gate signal is adjusted such that its delay and width are set to bracket the positive going portion of the spectroscopy amplifiers output. Only when the gate (green trace) is in a high state will the MCA will be active.
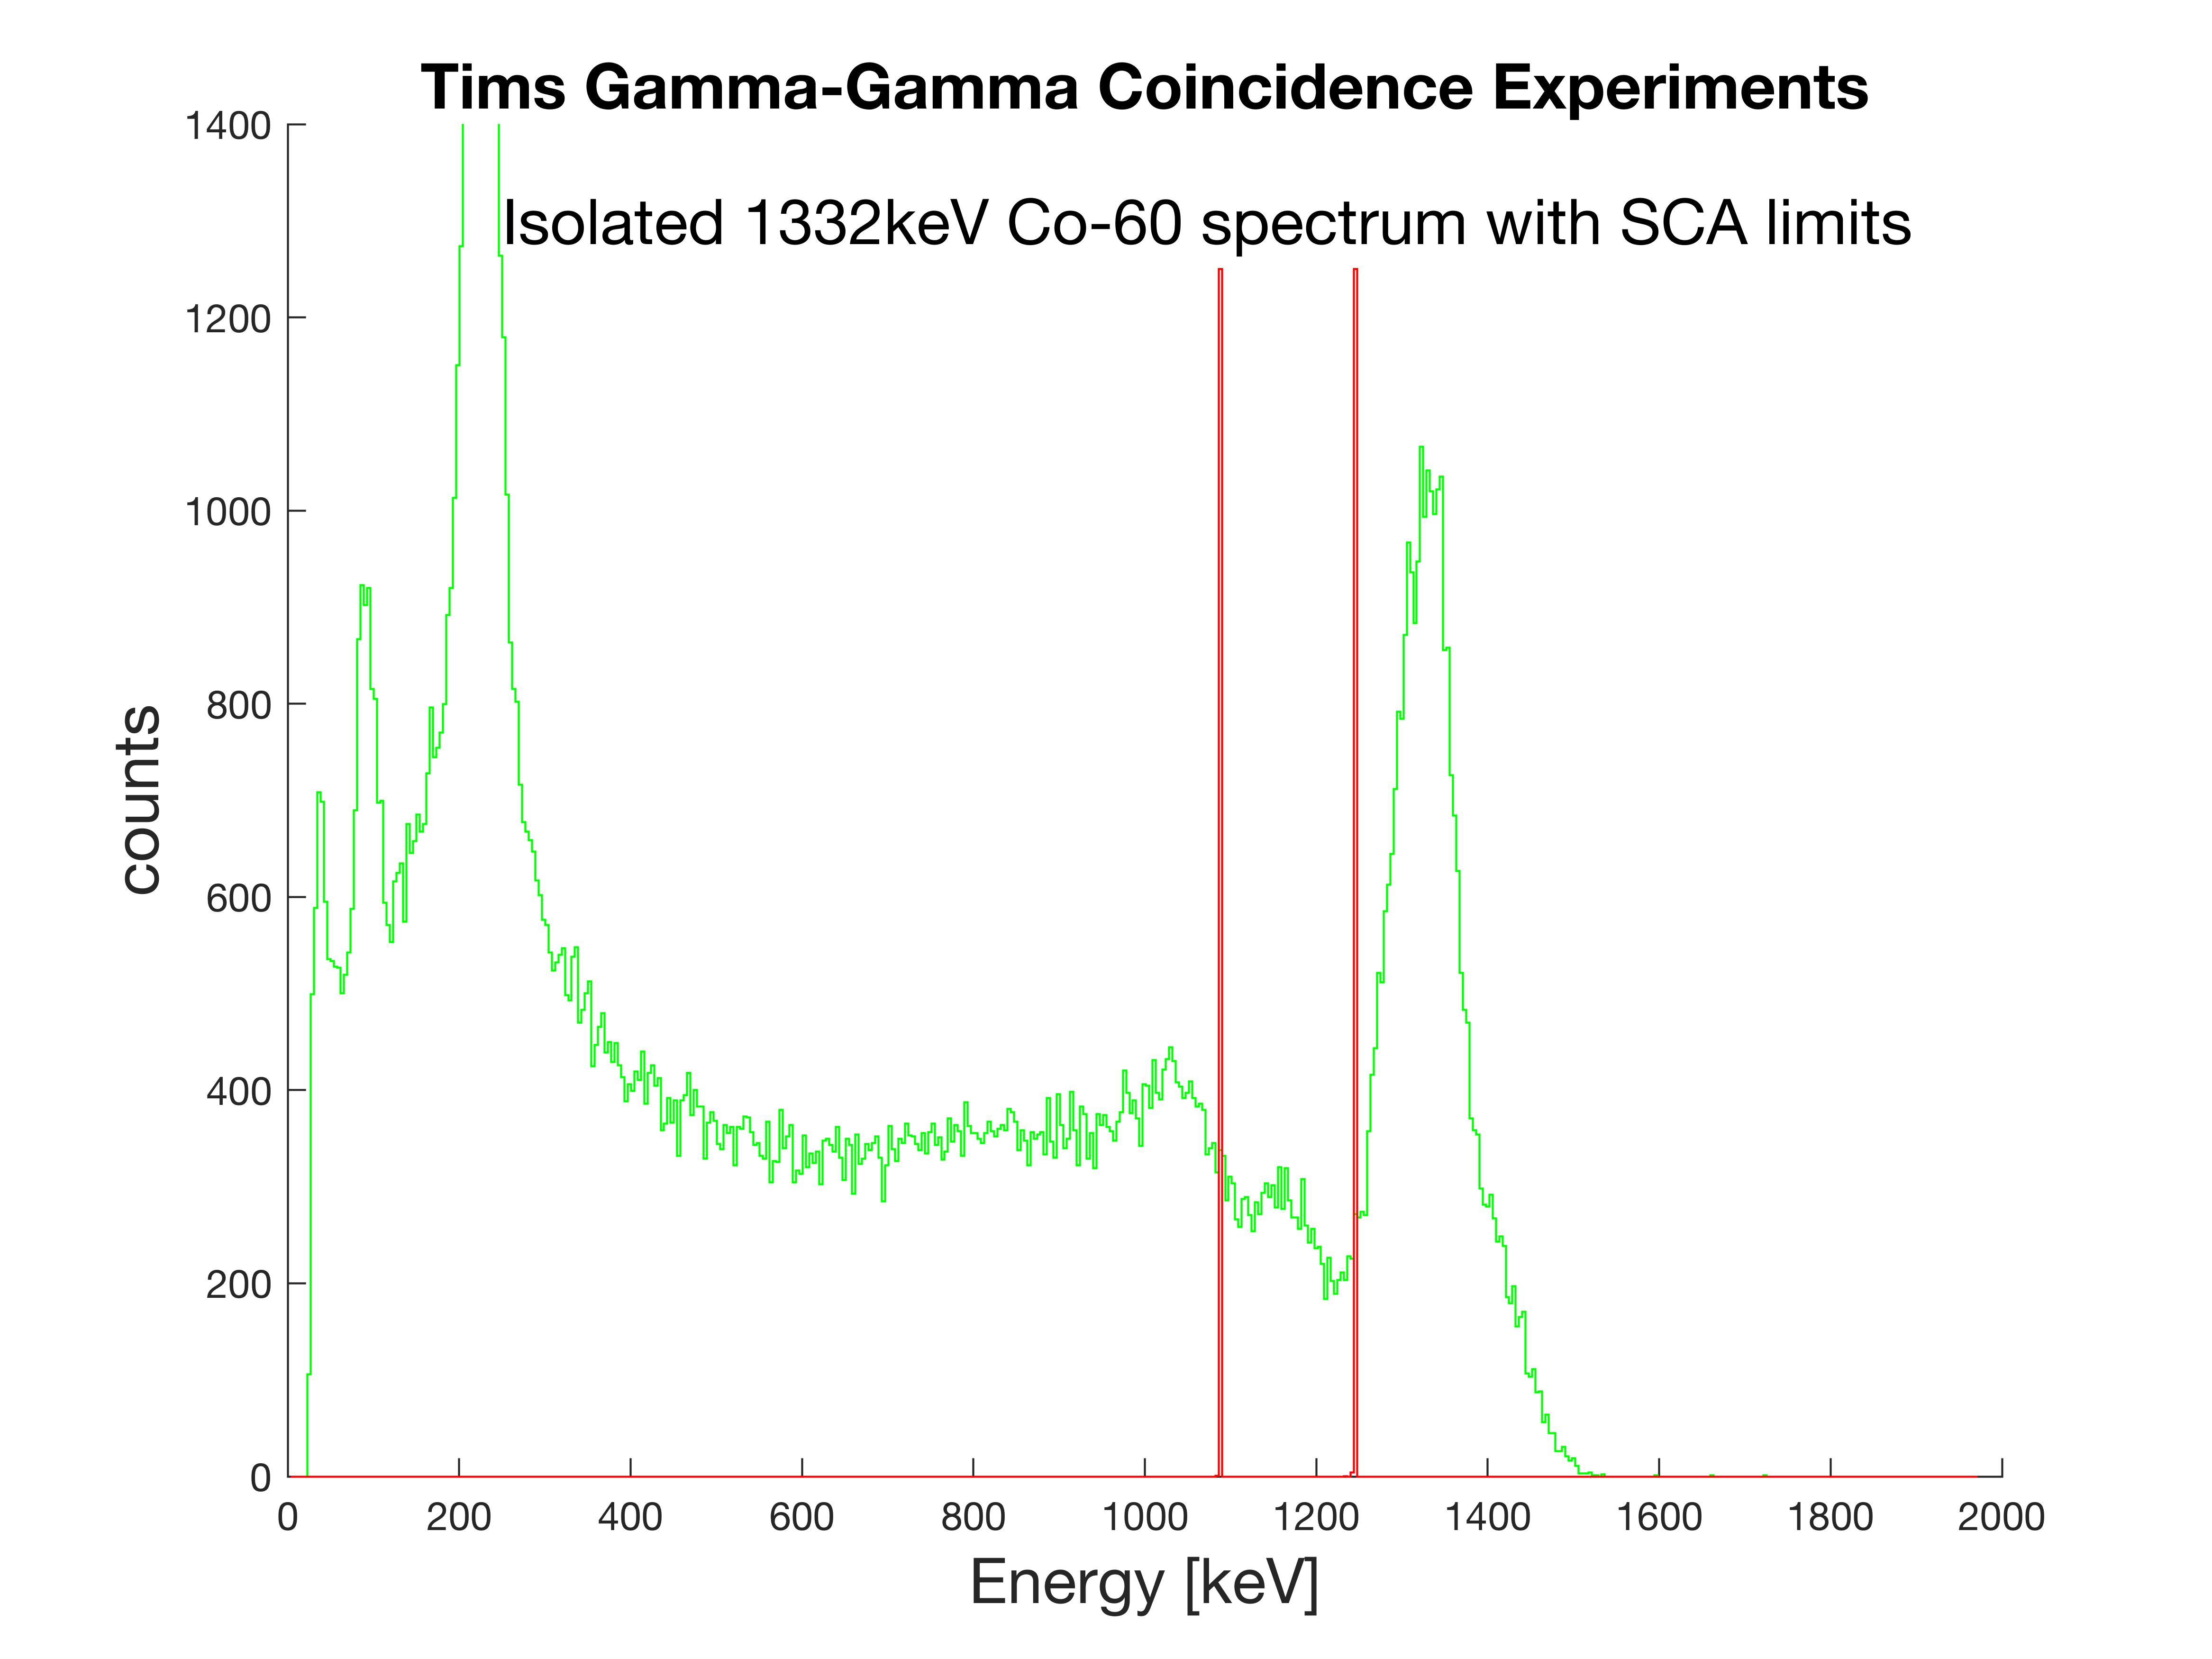
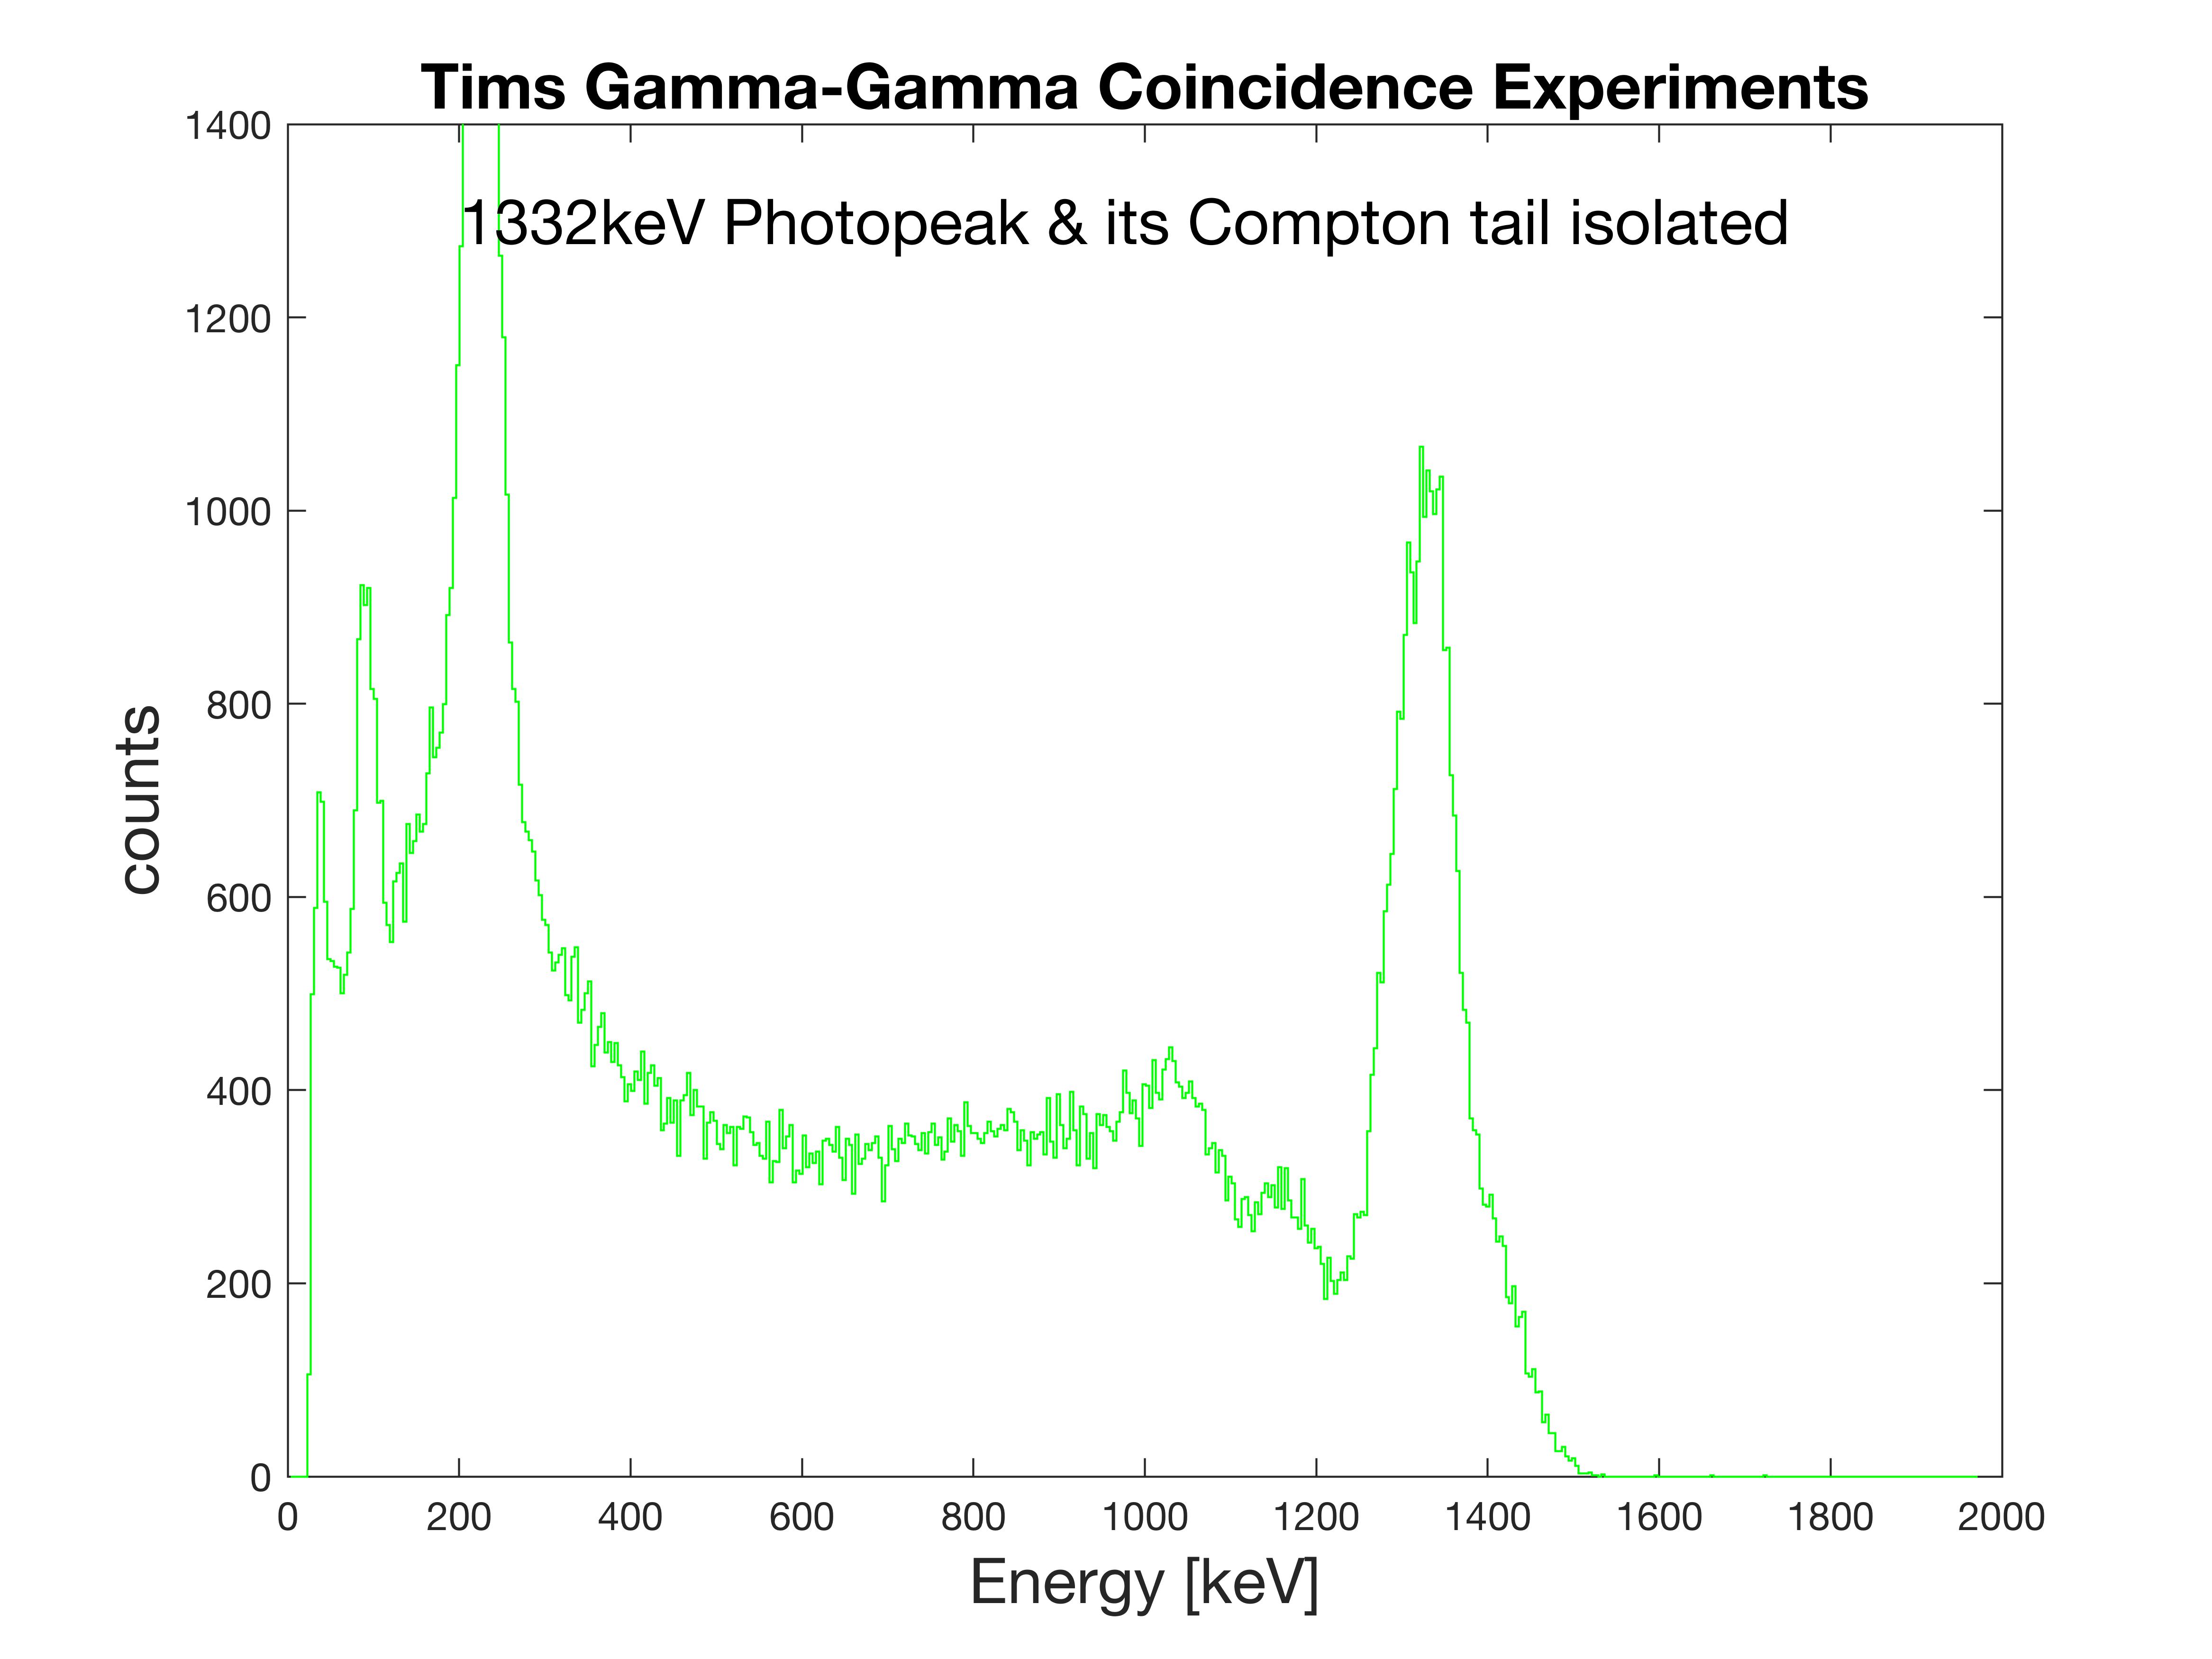
The following is the result of a gathered spectrum, the red lines show the energy selective window bracketing the 1173keV photo peak, and note how it is not there. The 1173 Compton tail is also not present, and this spectrum is solely that of the 1332.5keV line.
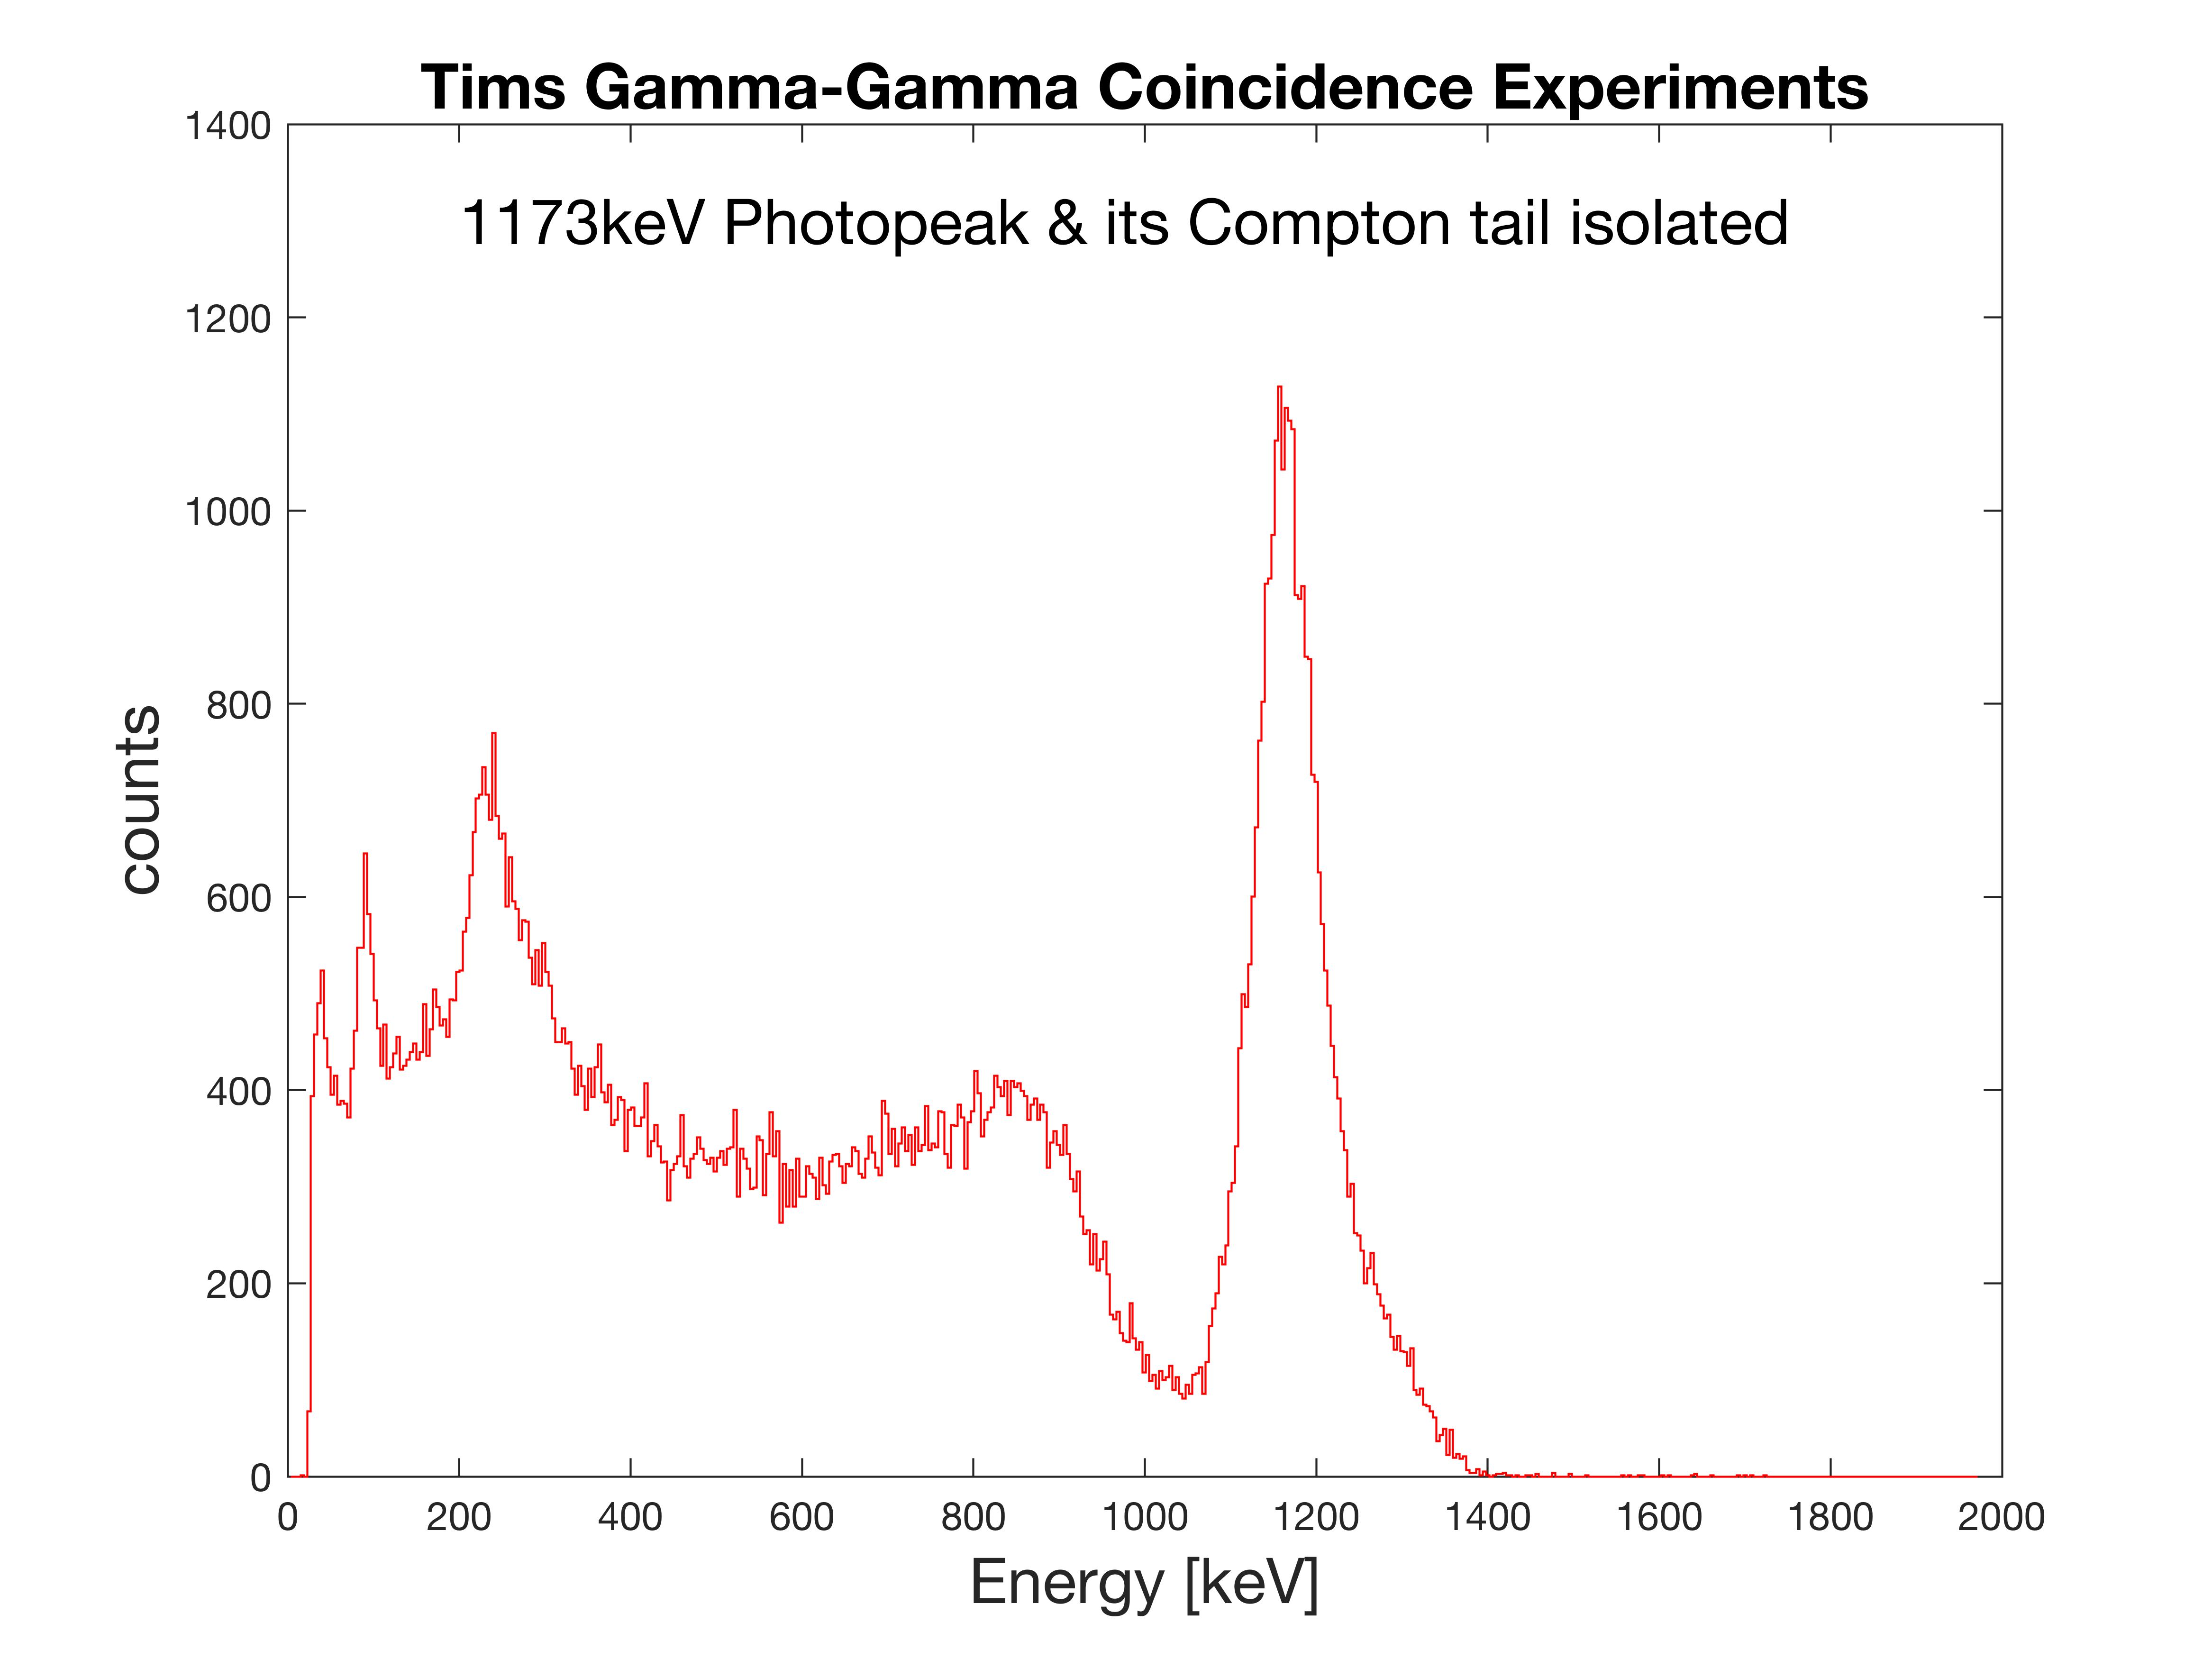
We simply change the energy selective window to bracket the 1332.5keV line and the 1173keV spectrum appears by itself.
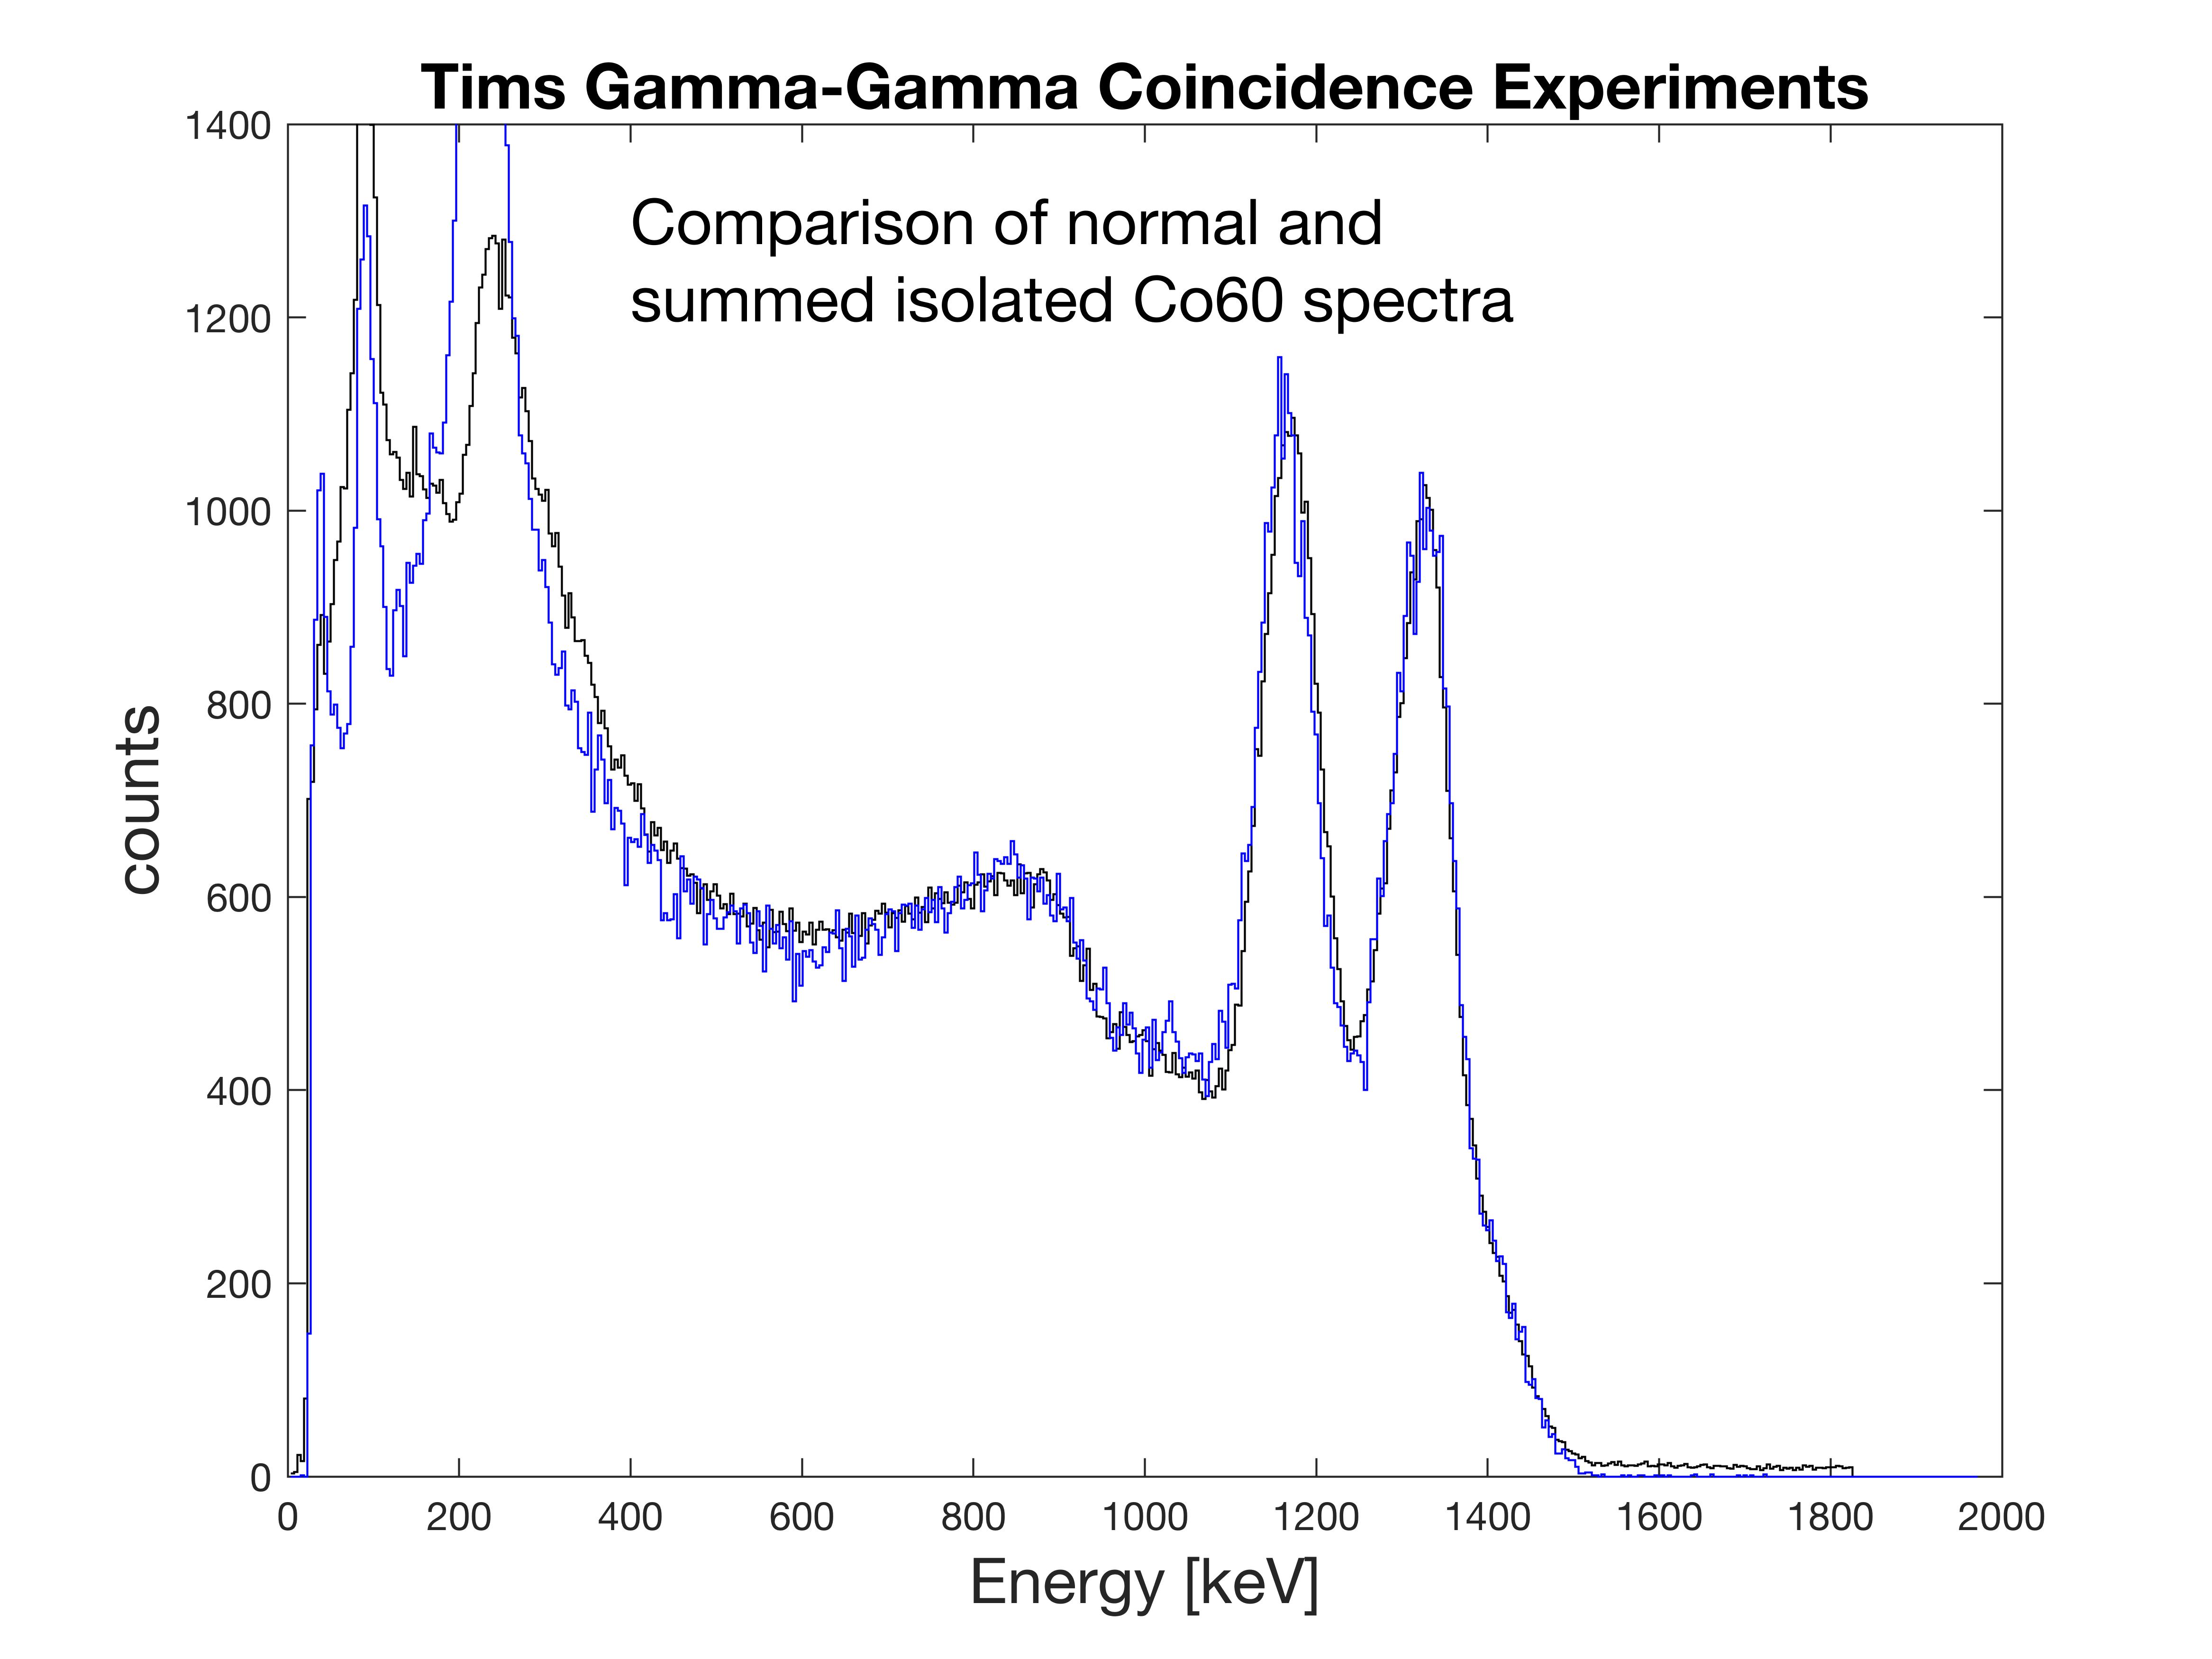
How did we do? We can compare the two isolated spectra with a standard non-gated 60Co gamma spectrum and we see that both the energies line up as well as a reduced Compton tail.

Does it all add up? Let simply take the date from the above plot and add them together and compare to the non-gated normal 60Co spectrum. Almost a perfect match! I do not understand why the 200keV line is so high for the 1332.5keV spectrum.
It took 25 years to get a second ScintiPack and a week of patient coincidence counting, and we can call this one a success!